Test Models
You must Save your model before you can use it in the Model Profiler or Predictor.
The Model Profiler and Predictor are useful tools to test your model's performance. The Model Profiler lets you see how up to three different features affect your model's target feature while the Model Predictor lets you see how different inputs might affect the model's predictions.
Using the Model Profiler
To use the Model Profiler to test your model's predictions with or without various inputs:
- Save the model you created with Train.
- Create a new API for the Profiler to use with your model. For example, to create a new API called "TitanicModelTest", click Skill in the skill menu and enter
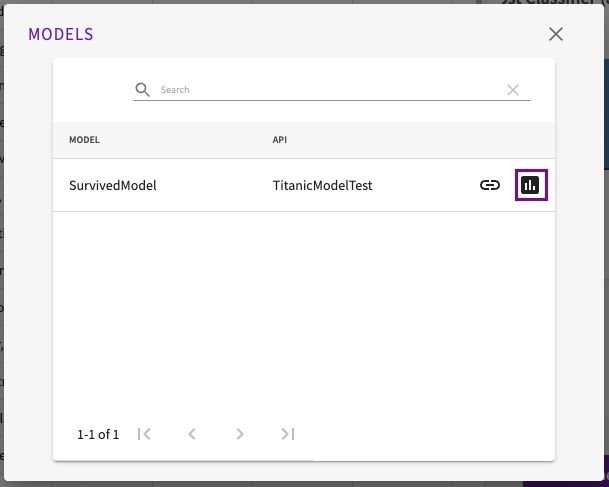
Create a new API TitanicModelTest. - Open the Profiler by clicking profile icon > My Models from the homepage.
- Select the model you want to work with.
Inside the Profiler, you can:
- See metadata about your model, such as its name and other model-dependent metrics, such as its accuracy.
- Use the Profiler to see how up to three different features relate to each other in the model
- Use the Predictor to see how the model's predictions change with given values.
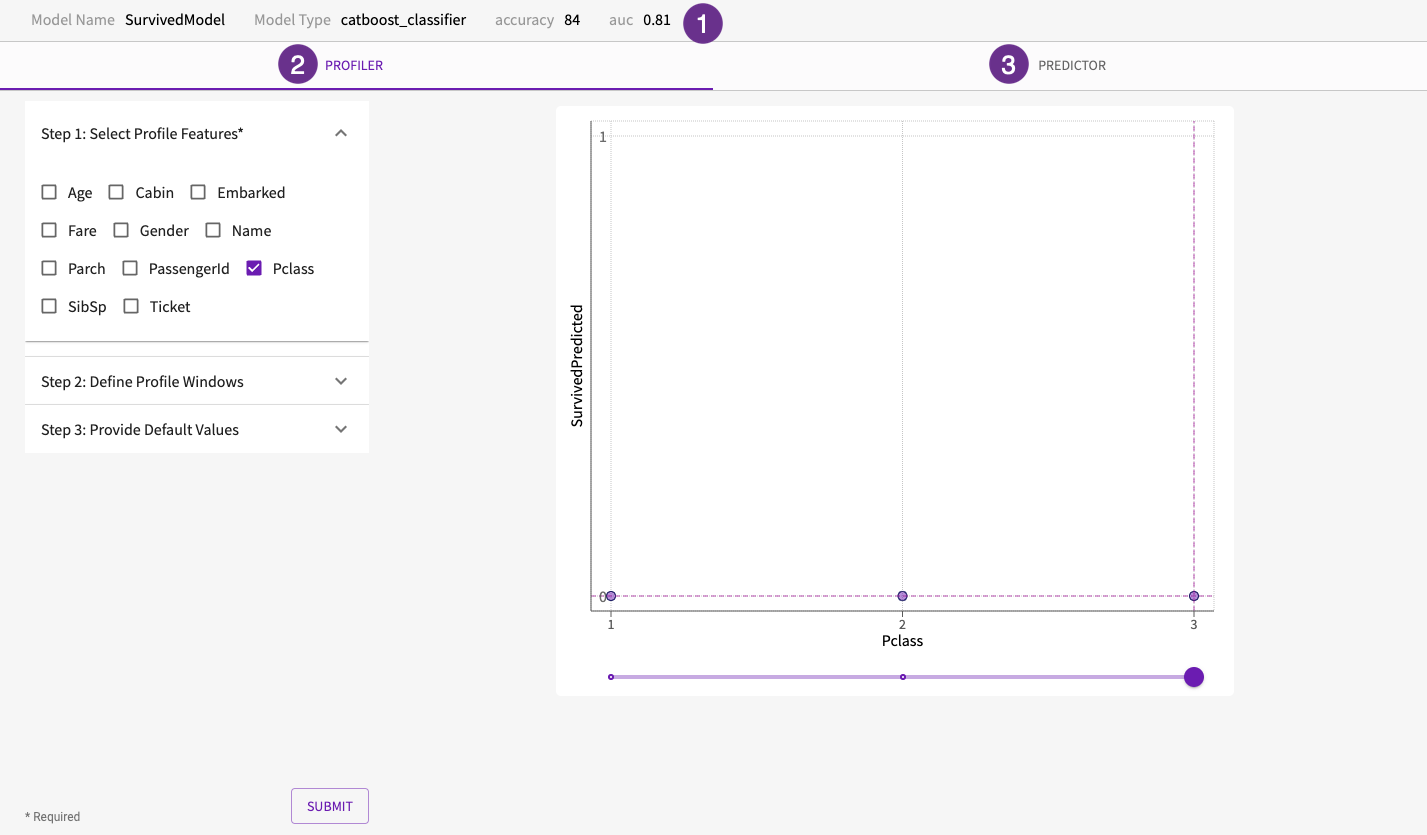
To profile your model:
- Select the feature columns to profile.
- Optionally, define the windows or subsets of those feature columns to use in the Profiler.
- For columns with continuous values, such as ages, you can pick the minimum and the maximum value to use. By default, the original minimum and maximum values are used. Up to 100 values can be selected.
- For columns with categorical data, such as ticket classes (first, second, third), you can choose to use a subset of those categories. By default, all of the categories are used. Up to 100 values can be selected.
- For columns with date or time data, you can choose the start and end date or time to use. By default, window starts at the earliest date or time and ends at the latest date or time.
- Optionally, define the default values to use for the columns that weren't selected. By default, the Profiler uses the imputed values provided by your model.
- Click Submit.
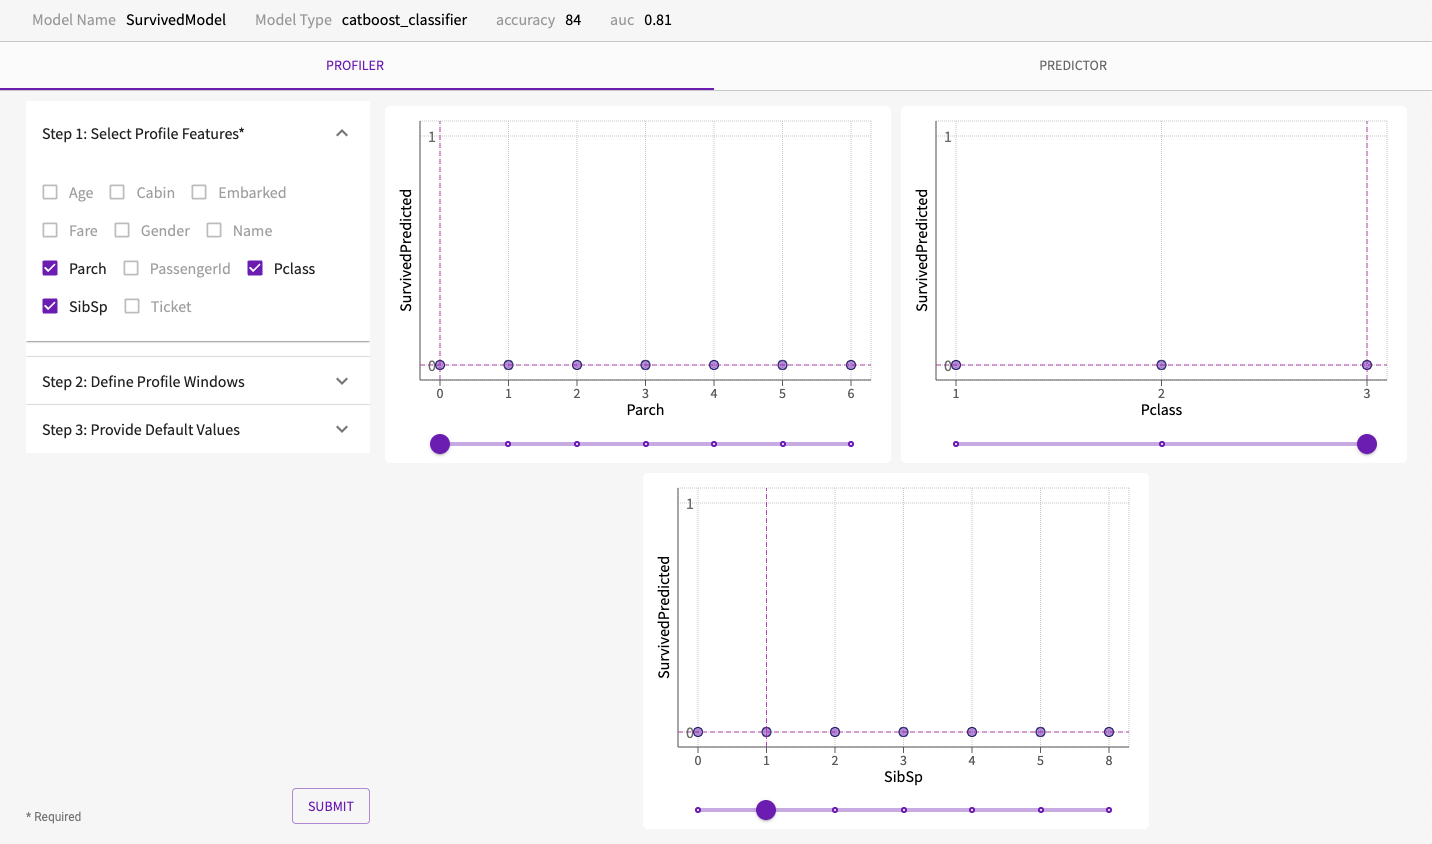
The Profiler creates one graph for each of the selected feature columns. The values of the feature column are on the x-axis and the predicted values of the target columns are on the y-axis. You can then use the slider at the bottom of the graph or click inside the graph to change the value of that feature column. If changing the value of that column affects the other feature columns or the predicted value, the other graphs automatically adjust to reflect that impact.
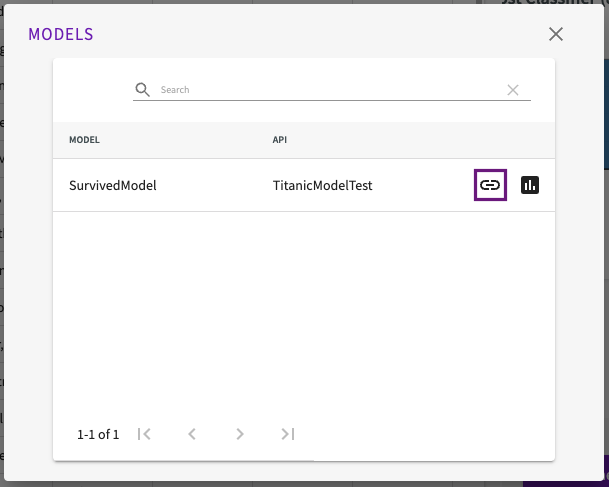
Share a Link to the Profiler
After you save your model, you can share a link to the Profiler by clicking the Shareable Link button.
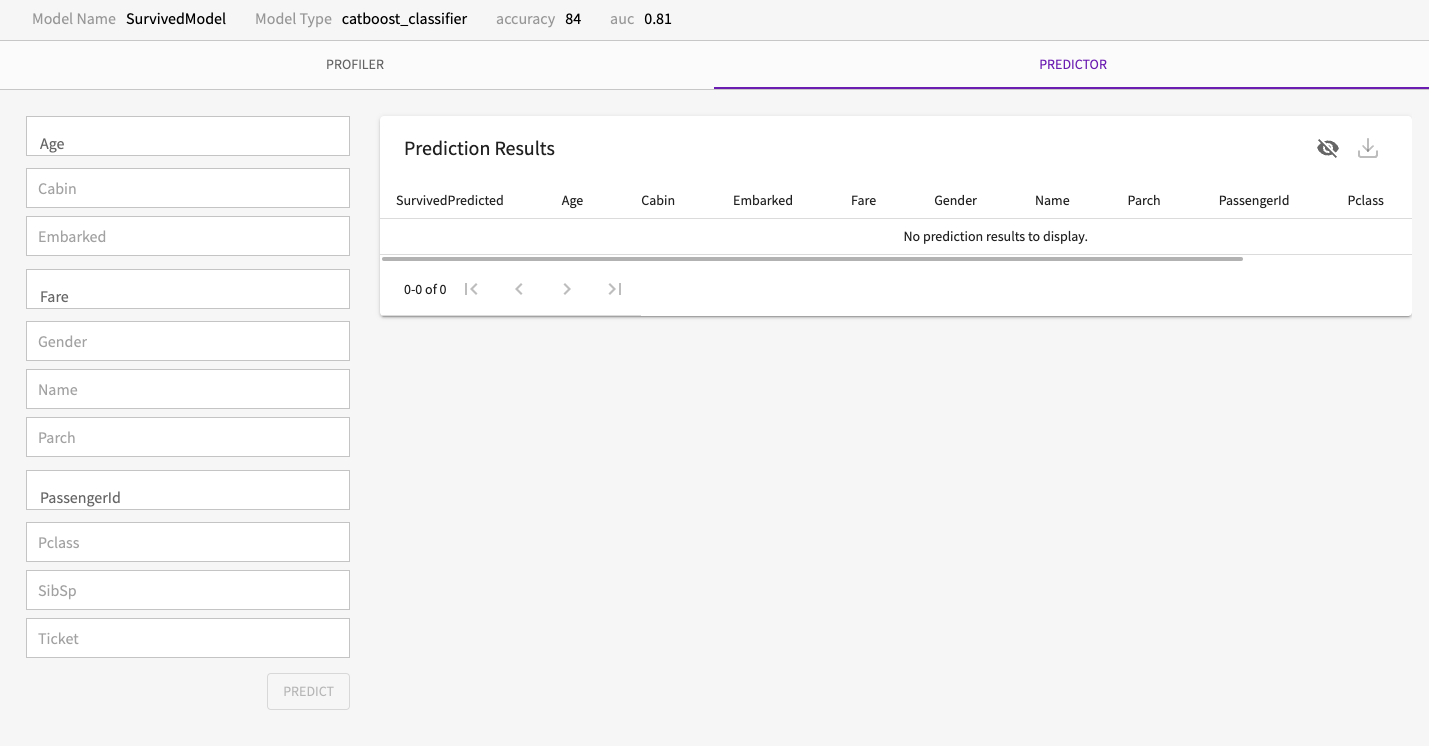
Using the Model Predictor
The Model Predictor lets you modify the input values used by your model to see how changes in those values might affect the predicted value.
To run a prediction:
- Open the Predictor by clicking Predictor within the Profiler.
- Modify at least one of the input values. Note that you don't need to fill in every value. In fact, you might purposefully leave some empty to see how the model is affected. Any inputs that are left blank use a default value (which is calculated by the model) to create the predicted value.
- Click Predict.
The model's output appears in the Prediction Results section: