Explore
After you've loaded data into your session, you can explore your data before diving in to analysis. By exploring your data first, you can better understand the type of data you're working with, its quality, and some general statistics.
There are several ways to explore your data:
- Using Show Descriptive Statistics
- Using Show Me Something Interesting
- Interacting with the dataset by
- Adjusting column widths
- Expanding cell contents
- Renaming columns
- Using the column's More menu
Show Descriptive Statistics
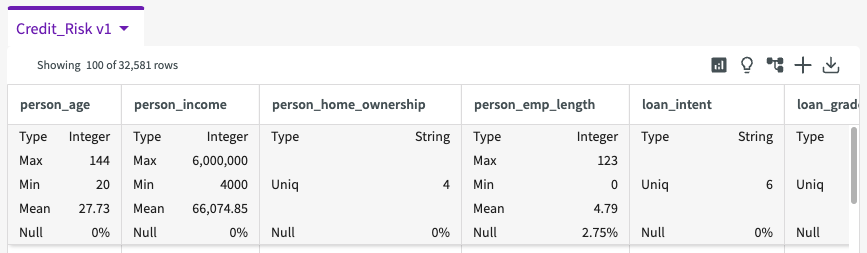
On the right side of the dataset header, you can click Show Descriptive Statistics.

This expands each column to display quick statistics about the values of each column in your dataset. This includes counts, unique counts, column types, means, minimums, maximums, and null percentages. High null percentages are flagged with a red indicator.
Show Me Something Interesting
Datasets must have at least four columns to use this feature.
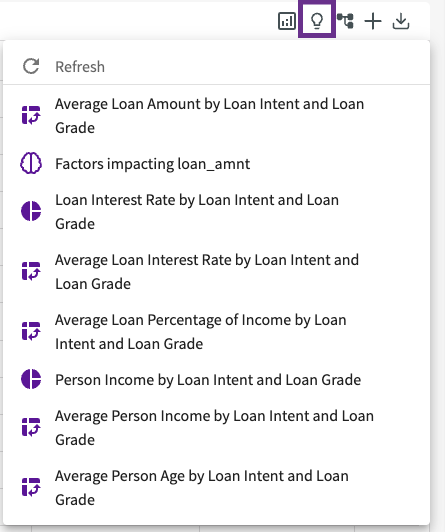
The Show Me Something Interesting feature uses AI to generate interesting questions and insights for your dataset. It can be accessed in two ways:
- On the right side of the dataset header, you can click Show Me Something Interesting.
- In the Data Assistant section, you can click one of the generated questions.
Dataset Header
This opens a list of suggested actions you can take on your data to help get to insights quickly. Clicking one of the suggestions with automatically run the skills needed to generate new charts and tables for your analysis. You can Refresh the list to generate more options.
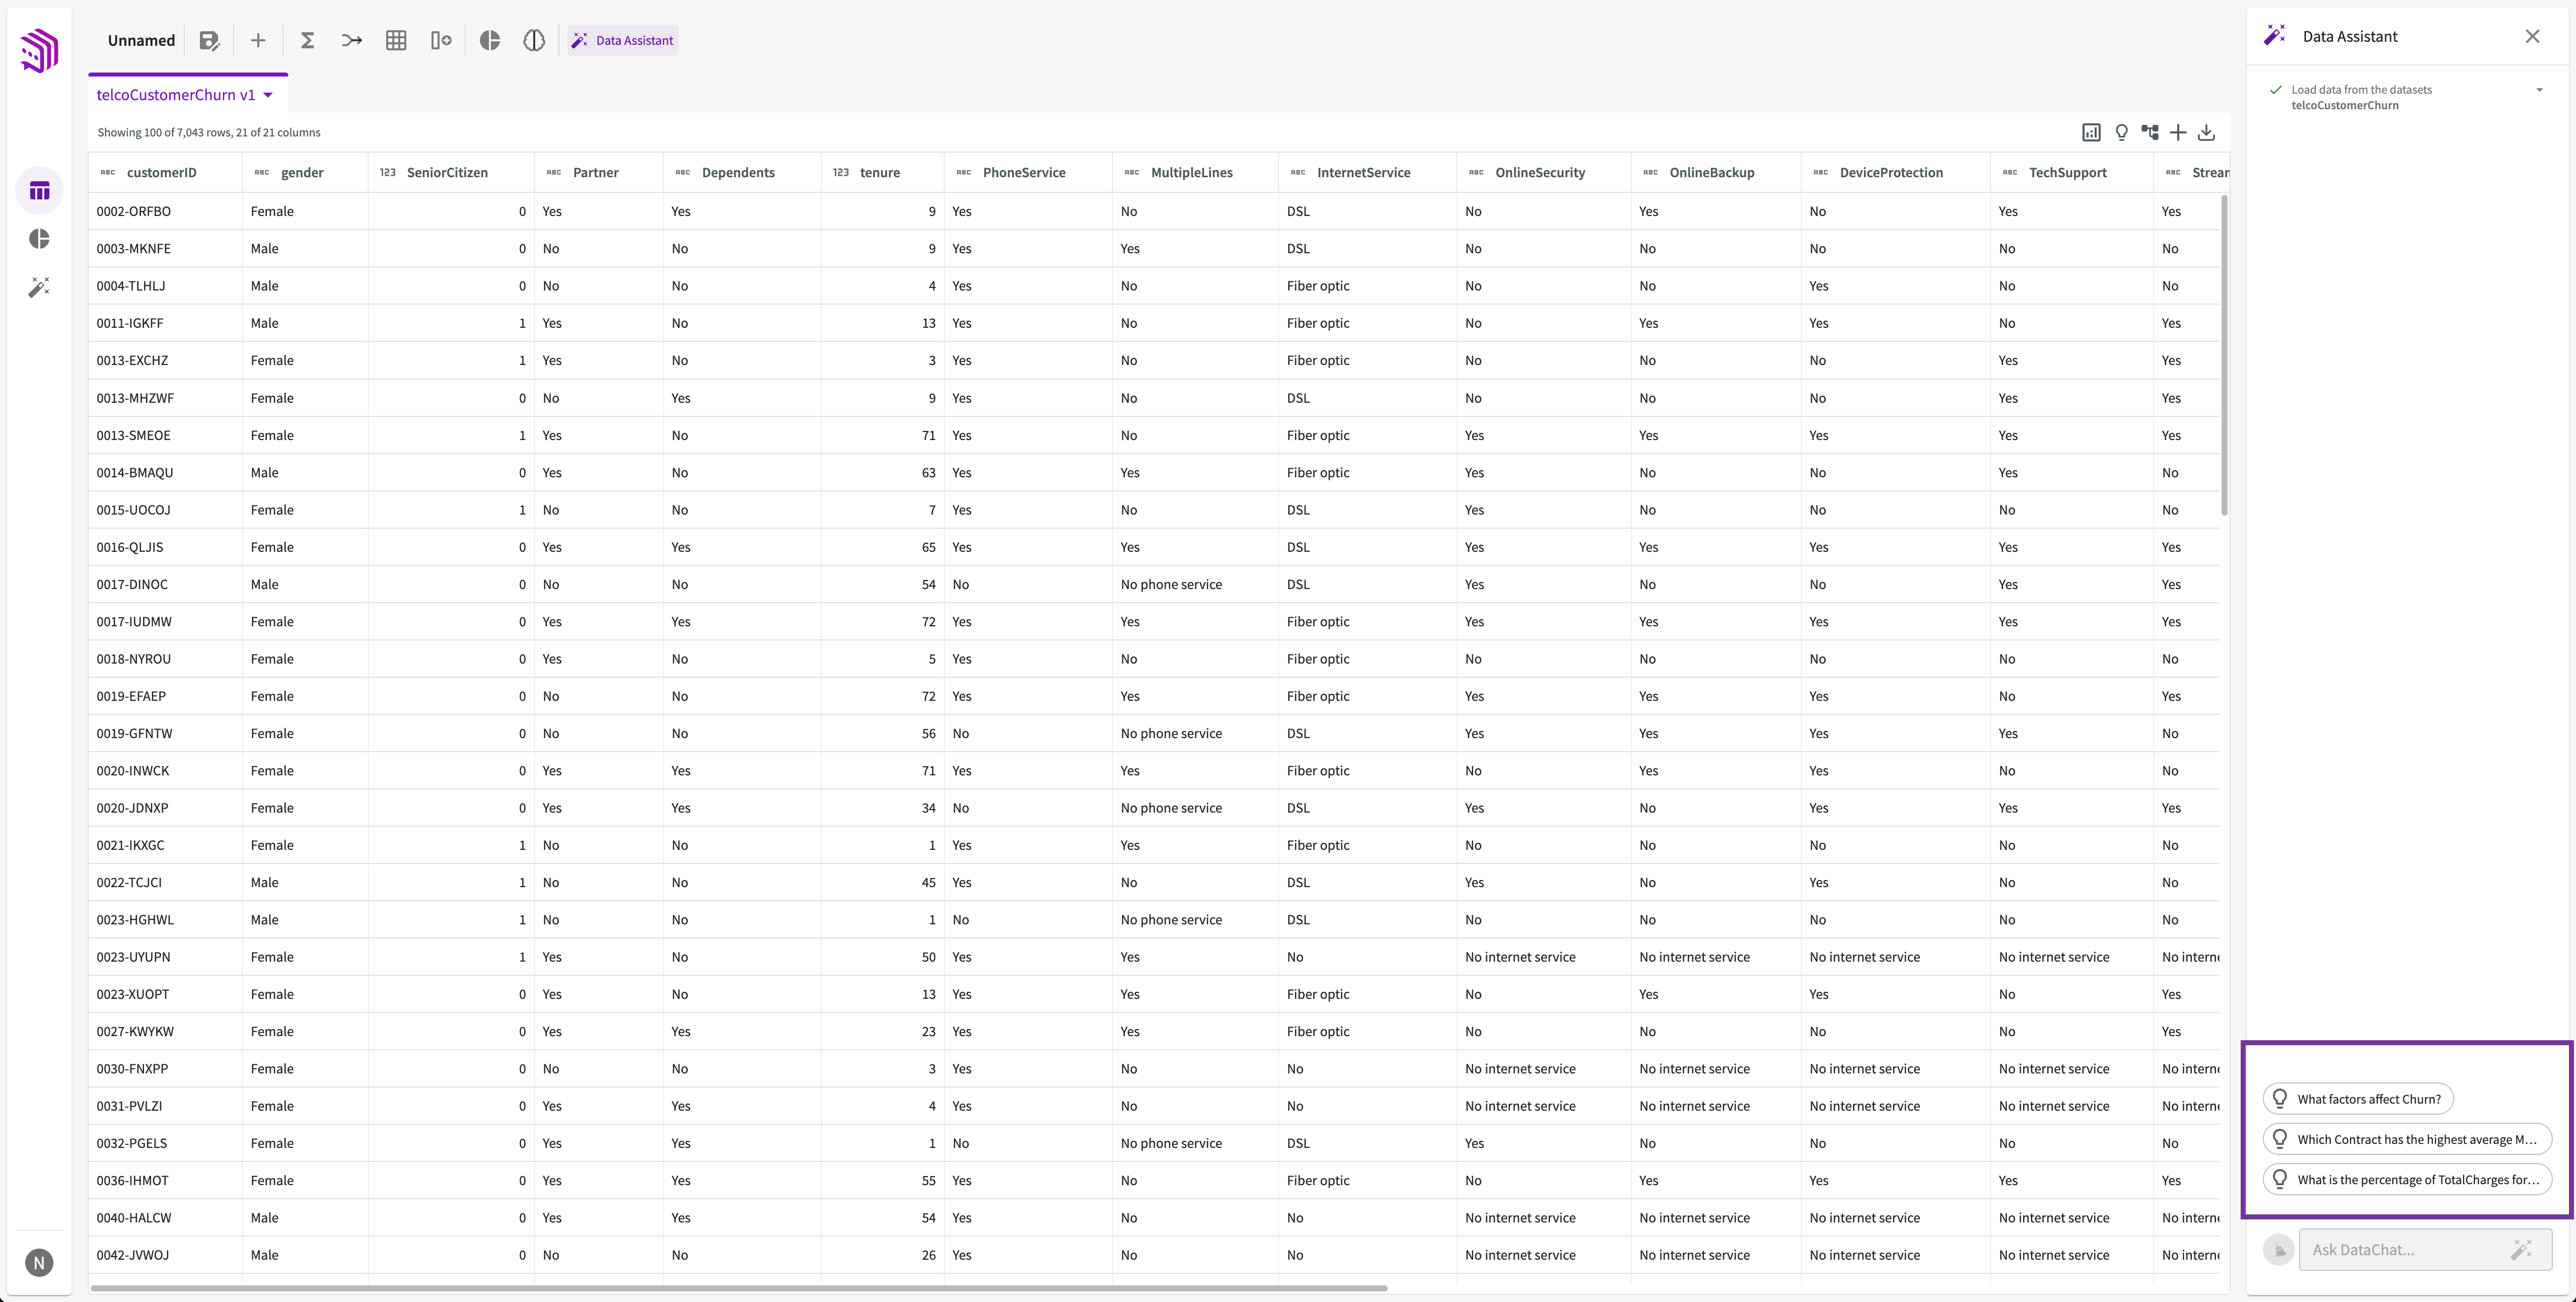
Data Assistant
When a dataset is loaded, several questions are generated and appear in the Data Assistant section. Click one of them to generate some insights into your data.
Interact with the Dataset
Adjust Column Width
You can adjust the width of columns by clicking on the divider between columns and dragging to expand or compress the column.
Expand Cell Contents
If the contents of a cell are truncated (indicated by an ellipsis [...]), you can click it to expand it vertically without needing to change the column width.
Rename Columns
To rename columns:
- Double-click a column name directly or click the More menu > Rename in a column header.
- Enter the new name.
- Optionally, to rename multiple columns simultaneously, continue double-clicking on each column name and enter the new names.
- Click Rename Columns once all desired columns have been updated.
Optionally, you can also press CMD + S (MacOS) or CTRL + S (Windows/Linux) to save your changes.
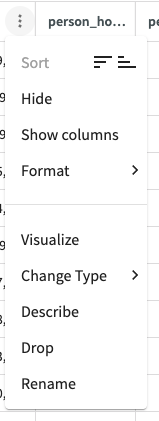
Use the More Options Menu
The More options menu has a couple options to explore and organize with your data. From top to bottom, you can:
- Sort columns in ascending or descending order.
- Hide or show columns.
- Visualize the column.
- Change the column type.
- Describe a column.
- Drop a column.
- Rename a column.