Introduction
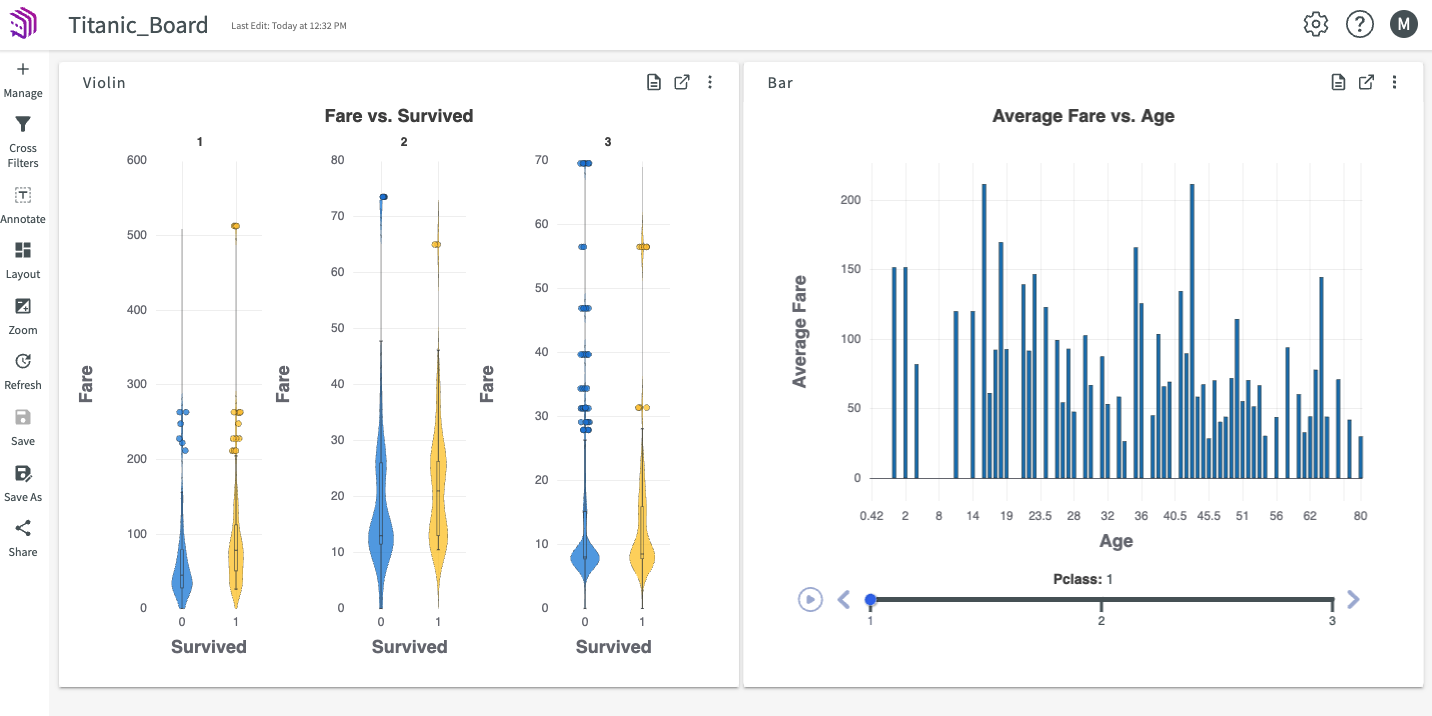
An Insights Board presents the findings from your workflow, such as visualizations, tables, and notes, in a customizable layout. It can be shared with other users in your organization and can be updated continuously if it's created on top of a live data source, such as a database.
An Insights Board is interactive. Investigate data in your charts, adjust visualizations, and page through tables just as you would in a session. You can also customize the layout of the panels within the Insights Board.
Insights Board Panels
Each chart, note, and table published to an Insights Board occupies its own panel.
Interact with Panels
Each panel can be moved around the Board and resized. To move a panel, click and hold the header, and then drag the panel to its new position. Release the mouse to drop the panel. To resize a panel, click and drag the corners or the left, right, and bottom edges.
You can also resize the panels using Layout in the sidebar by selecting from Default, Wide, and Thin layouts.
Hover your mouse over a chart for details, change slider values, zoom in on sections, double-click to return to the full-sized chart, and more.
Change Canvas Zoom
You can zoom in and out on the Insight Board's canvas using the Zoom button in the sidebar.
Refresh Content
Click the Refresh button to refresh your charts, tables, and notes. This reruns the underlying workflow that created the chart or table and updates it with any changes in the data. Each panel has a timestamp showing when the content was last refreshed.