Cluster Data
The Cluster skill helps you train clustering models to divide groups of abstract data into classes of similar data. This is especially helpful in identifying new information and patterns in large amounts of data.
Click ML > Cluster Data from the skill menu, then:
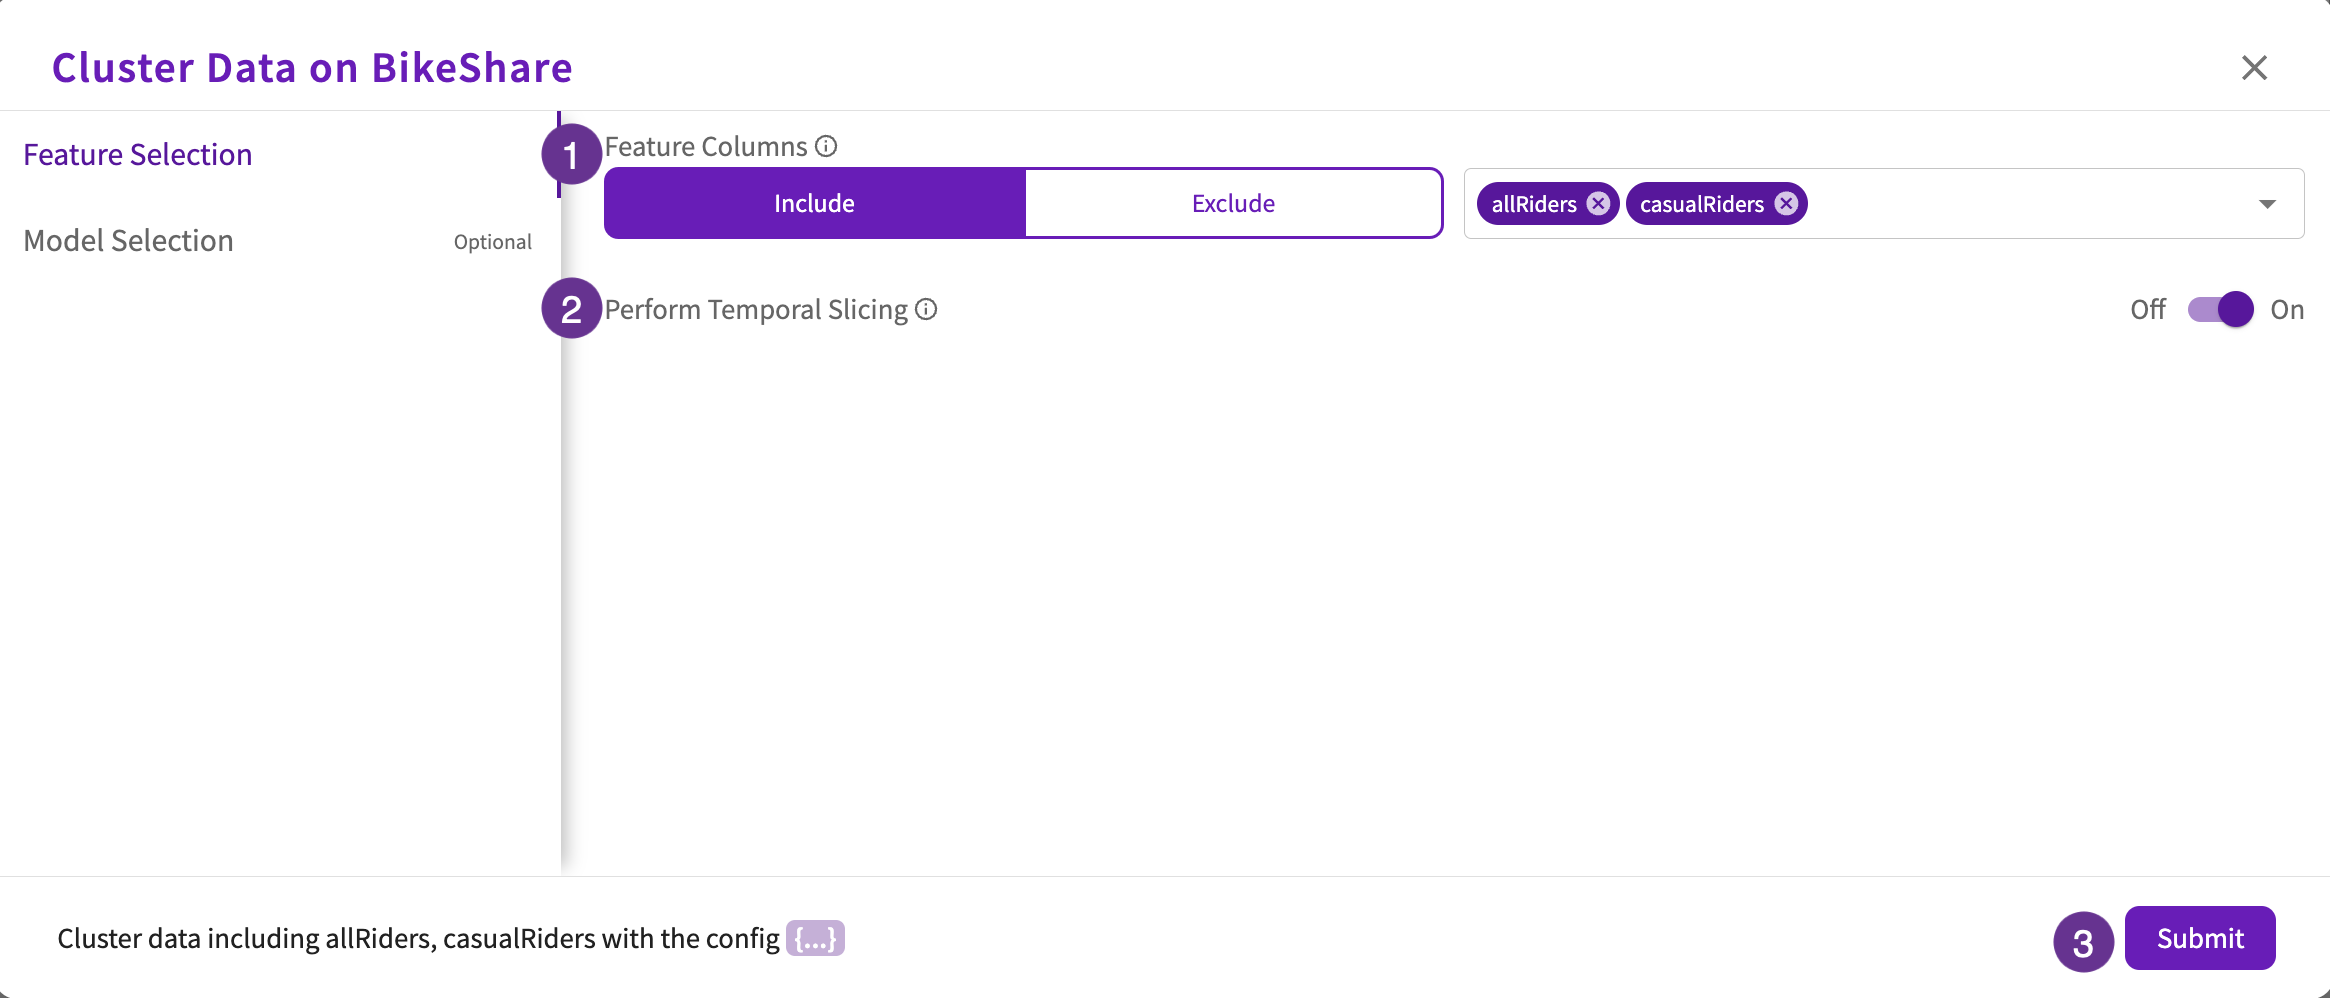
Feature Selection (required)
- Select feature columns to include or exclude in clustering.
- By default, the Perform Temporal Slicing toggle is set to "On" to slice temporal columns into their datetime components. Optionally, you can switch this toggle to "Off".
- Click Submit or continue to Model Selection for more granular control over the models used in clustering.

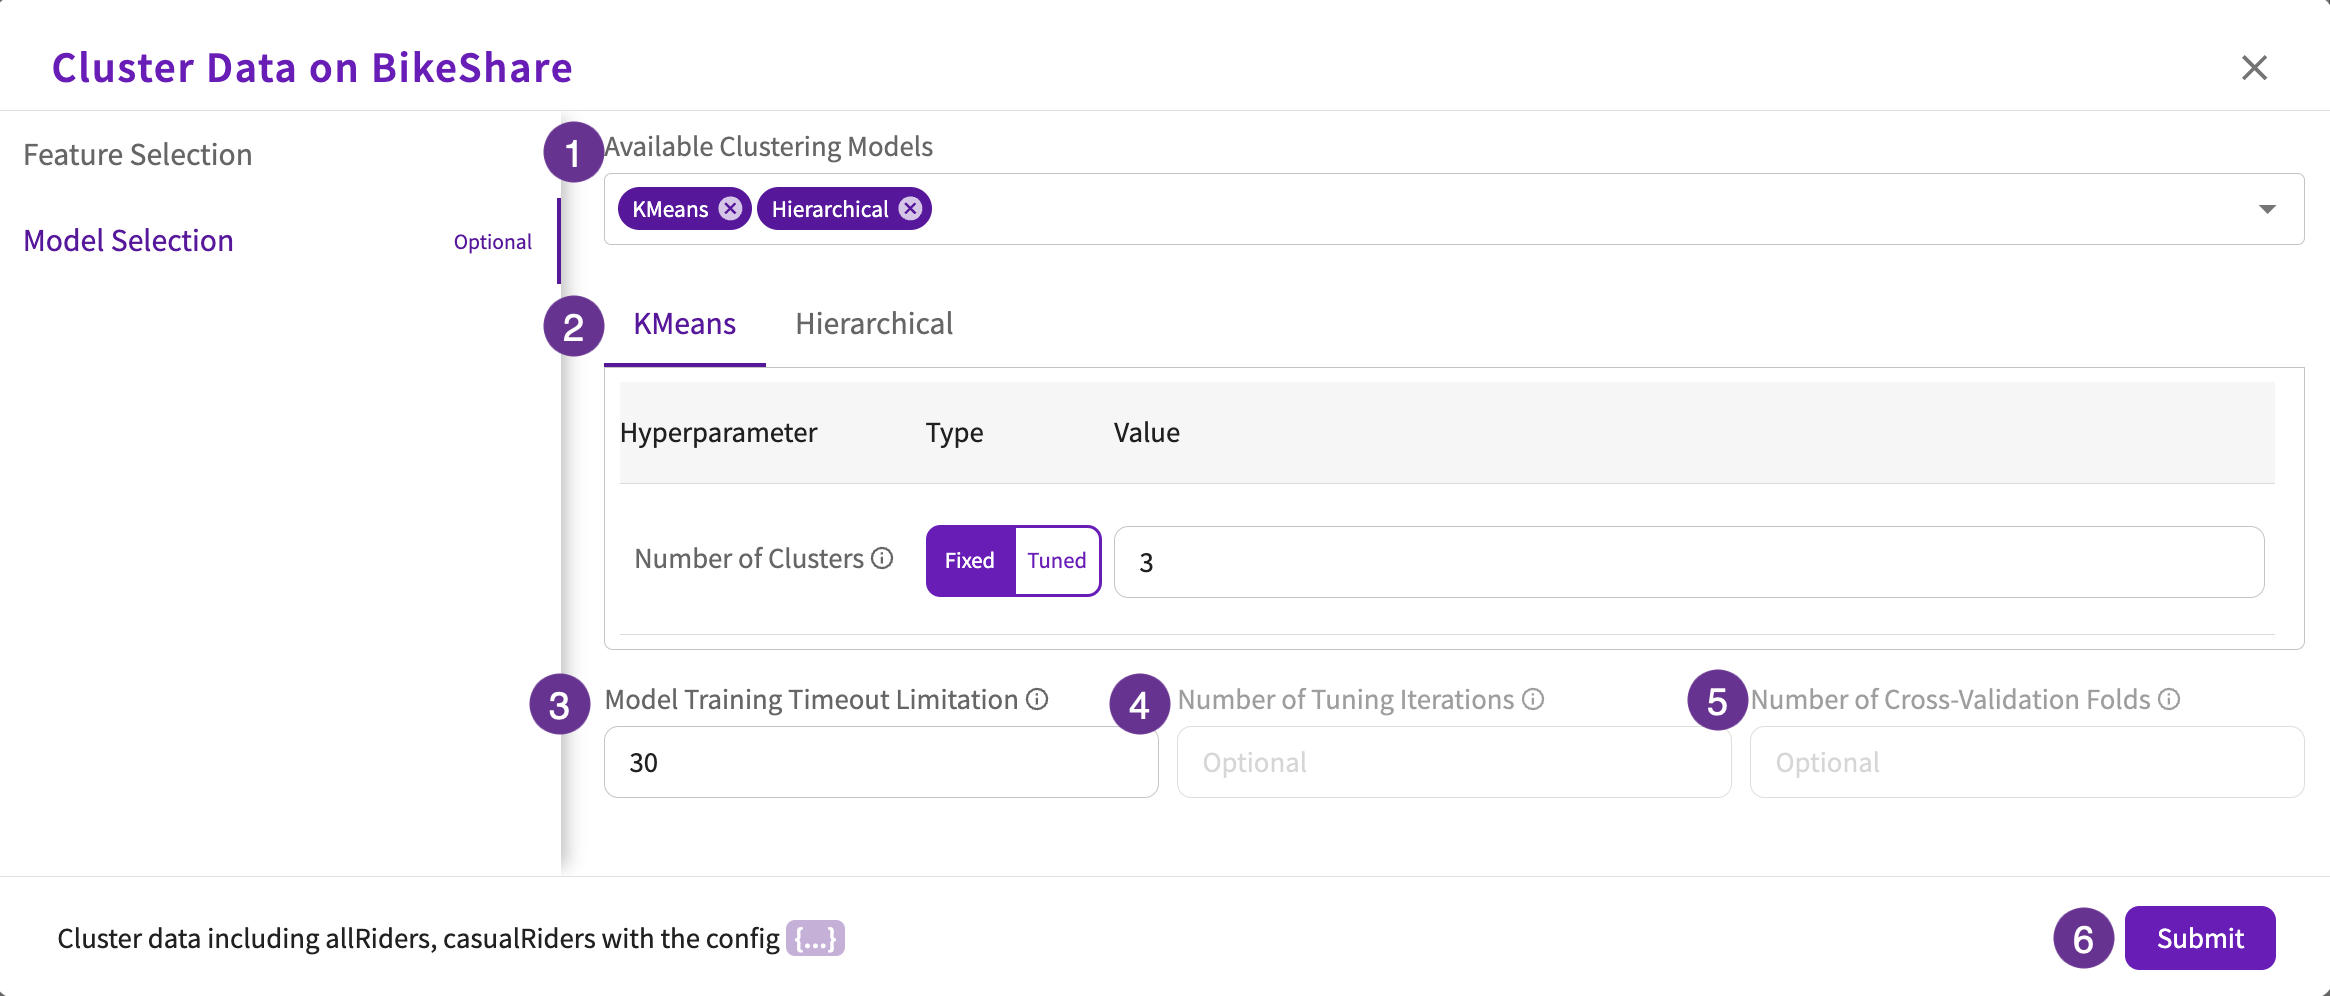
Model Selection (optional)
- Select the clustering models to use. Note that the available models are KMeans and Hierarchical.
- Select the hyperparameter types and values for each selected model.
- Enter the maximum time allowed (in minutes) for training the selected models.
- If the clusters are tuned, enter the number of tuning iterations to find the best hyperparameter combinations.
- If the clusters are tuned, enter the number of cross-validation folds to split your data into.
- Click Submit.

BigQuery ML
For information on BigQuery ML permissions, refer to Database Types.
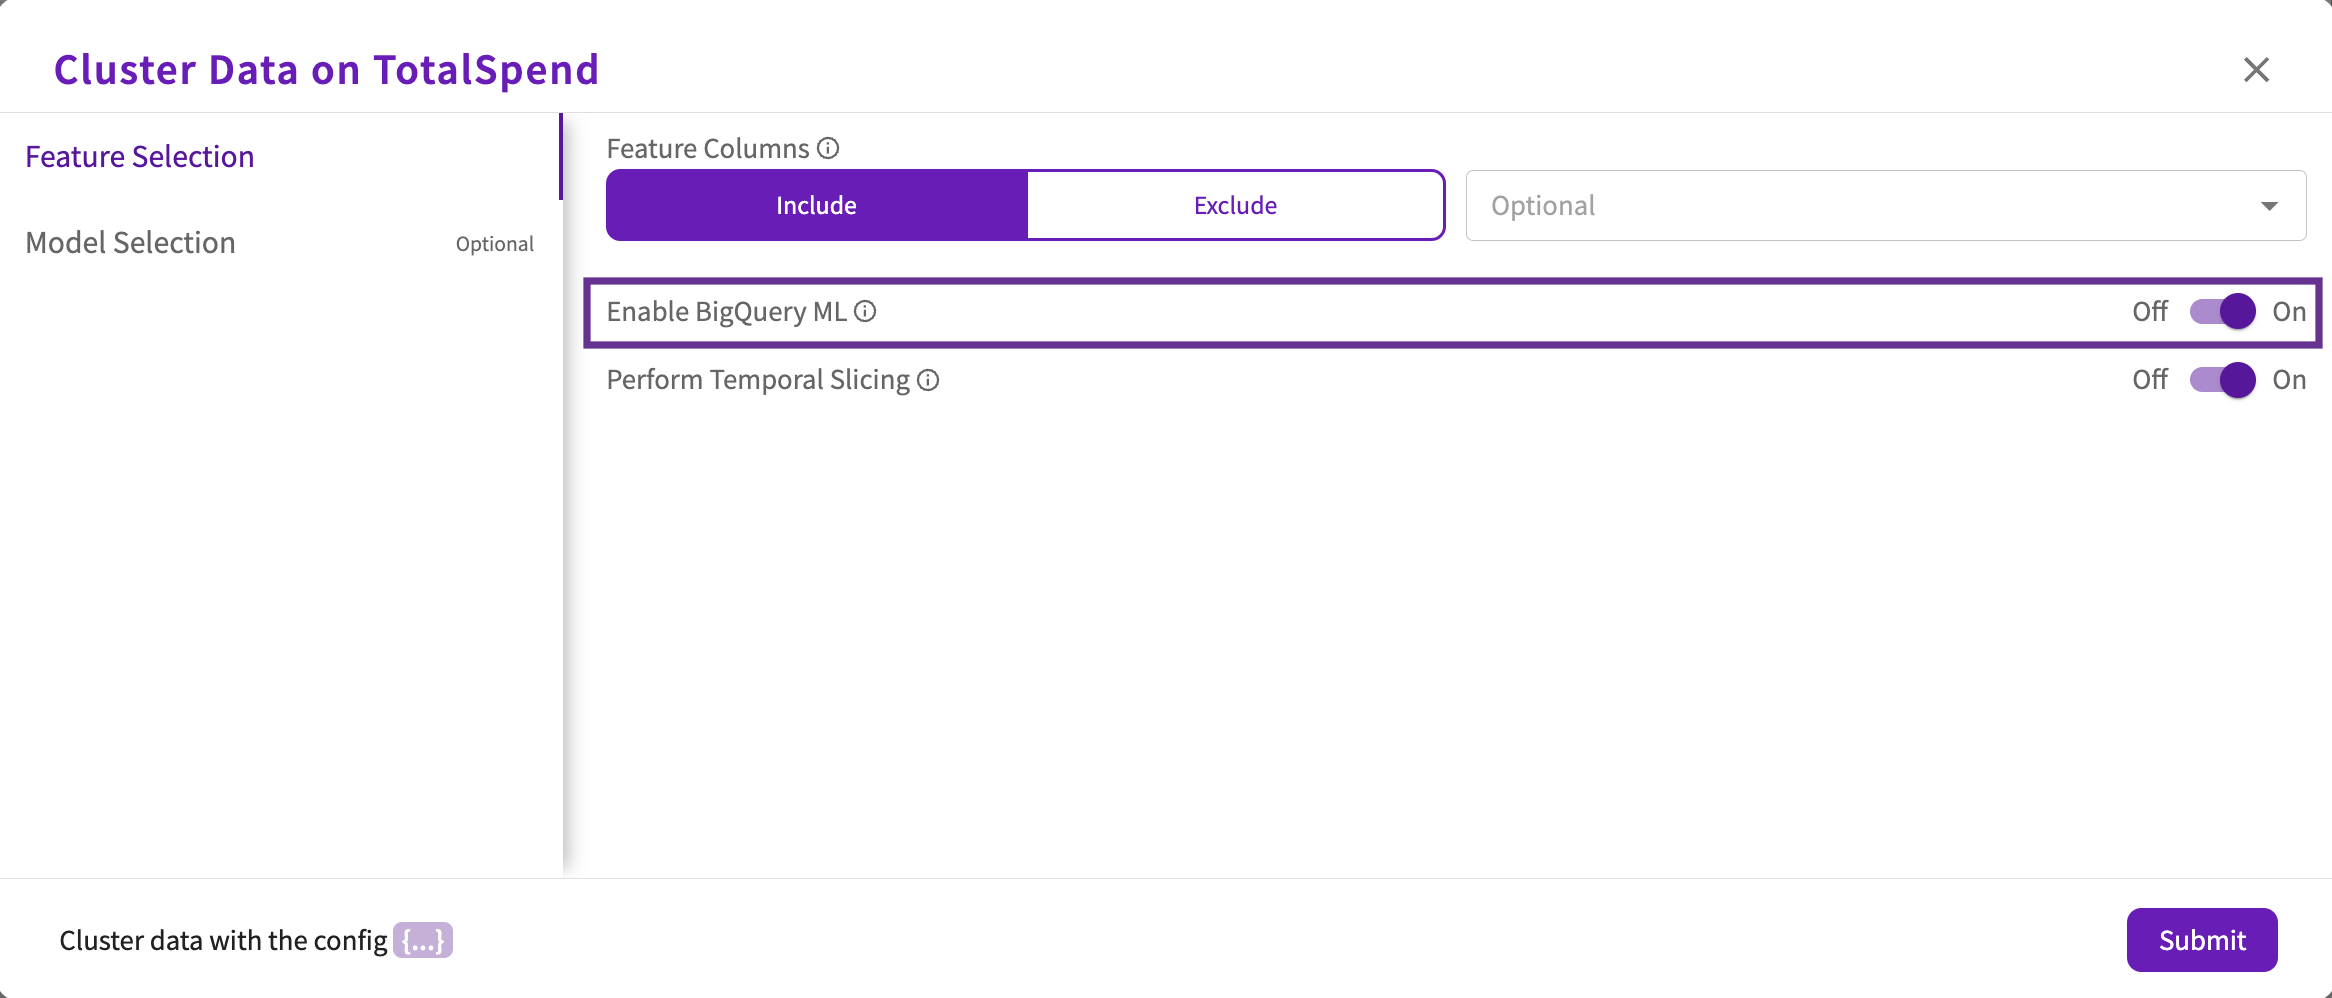
If your dataset came from a BigQuery connection, you can optionally toggle the Enable BigQuery ML option under Feature Selection, which is enabled by default for BigQuery datasets. When enabled, DataChat leverages BigQuery ML to train models.

By default, DataChat explores the BigQuery KMeans model. Optionally, you can specify the hyperparameter types and values under Model Selection.
Tabbed Output
When Cluster is finished, the output appears in the Chart tab. It provides a number of important output tabs in the chart header.
Cluster Centroids
The Cluster Centroids section shows the data points that represent the center (the mean) of a given cluster.

Models
The Models section shows the model type that was used, either the KMeans Clustering Model, Hierarchical Clustering Model, or both if neither was specified, along with each model's silhouette score and model report.

Scores
The Scores section displays each metric and their corresponding score. Click the metric name for more information on how it's scored.

Pipeline Report
The Pipeline Report section shows detailed information about each step of the model training process (known as a “pipeline”). From this report, you can see important information from each step of the clustering model training process.

Dataset Output
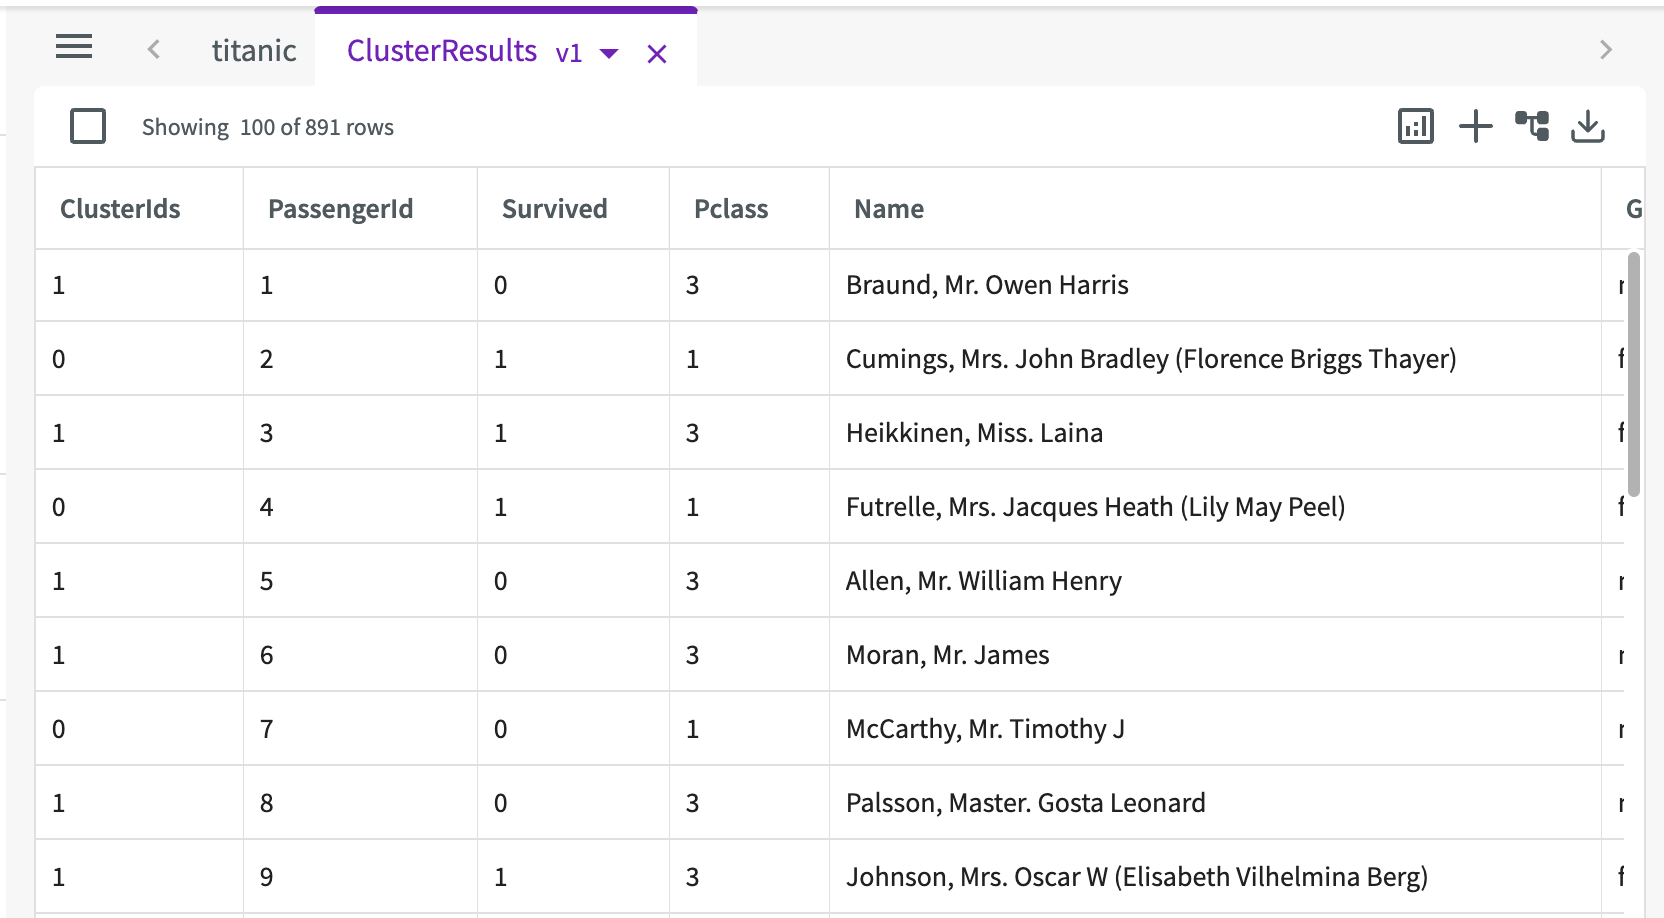
Cluster also provides a "ClusterResults" dataset that appends a "ClusterIds" column, providing each row with the associated ClusterId from the cluster centroids.
