Guided Learning
This section explores workflows in DataChat using the "Titanic Dataset". In this example, we'll perform an analysis on ticket fares.
Load Data
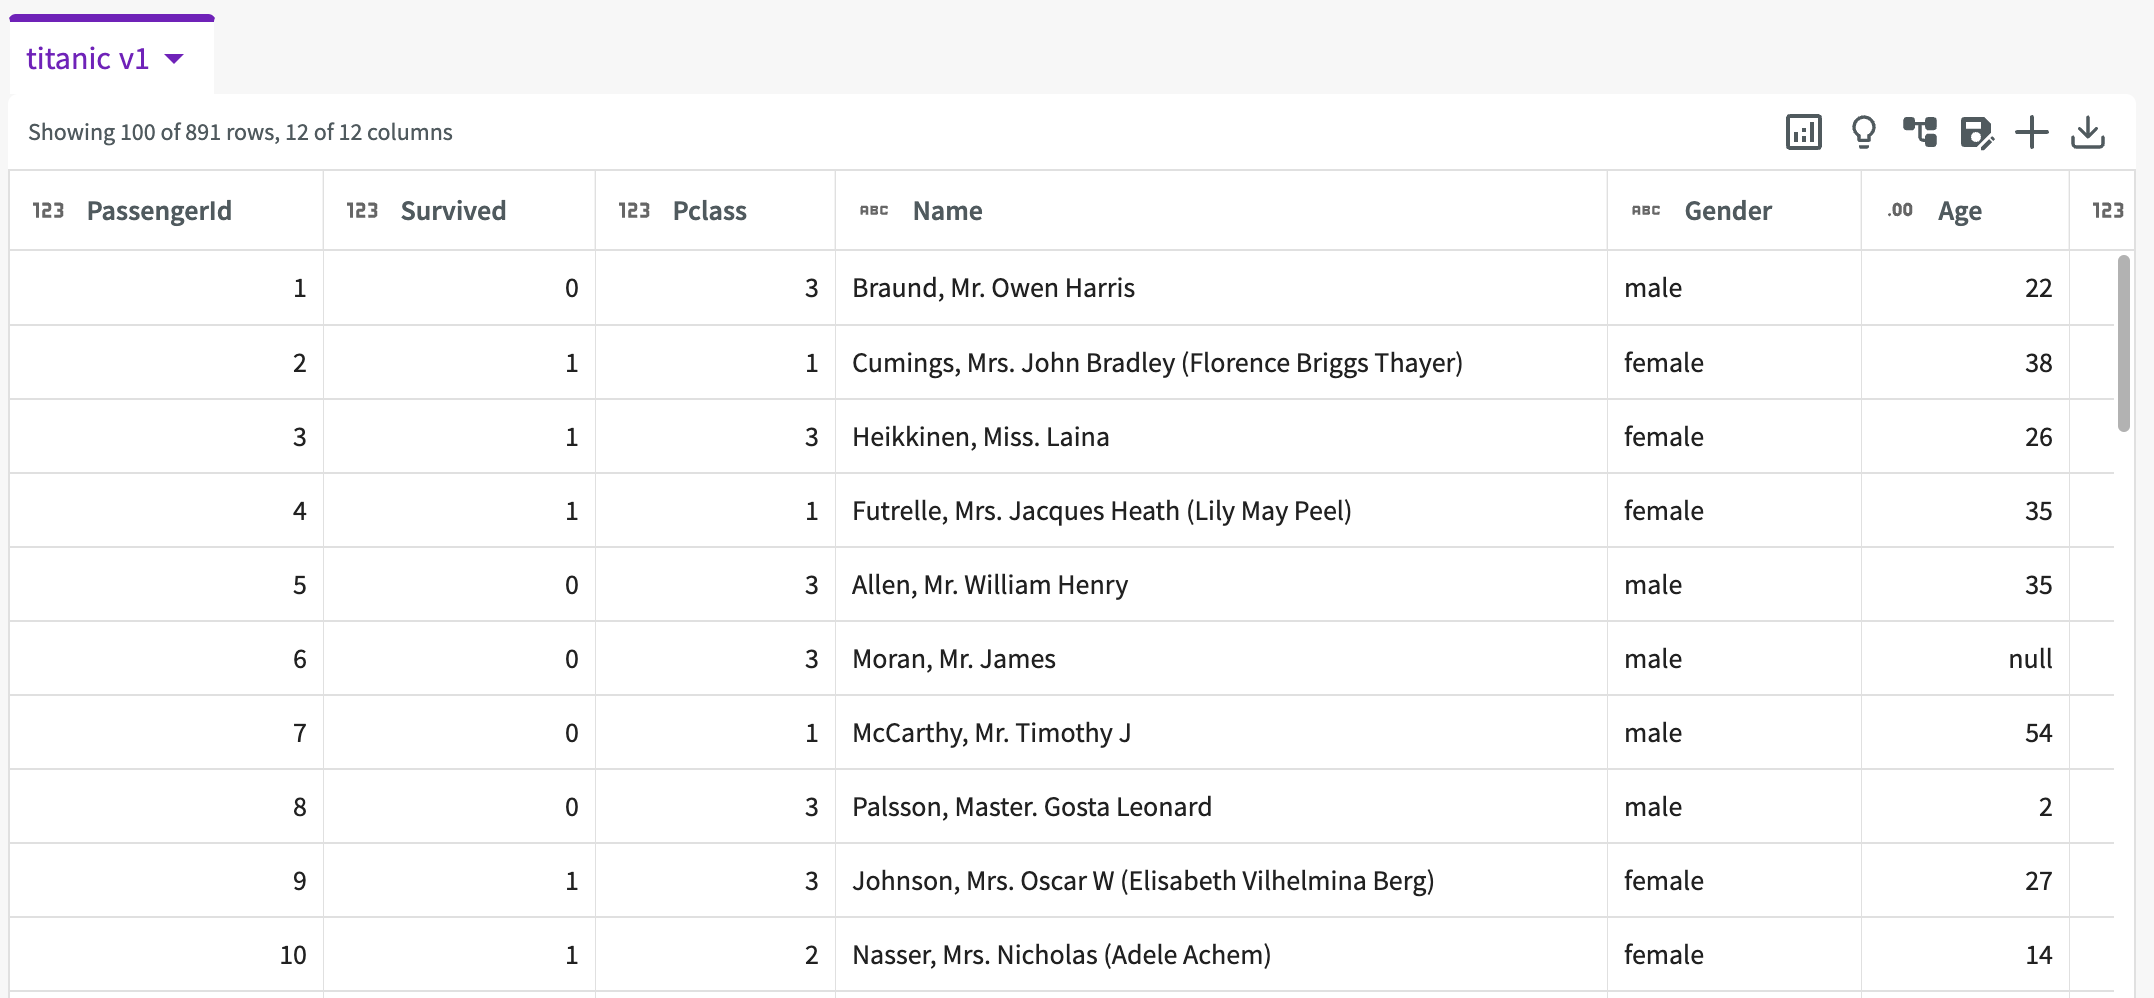
To start, Load the "Titanic Dataset" into your session. We're given a sample of our data that looks like this:
Work with Your Data
Let's clean our data by removing unneeded columns.
-
Click Wrangle > Drop Columns in the skill menu.
-
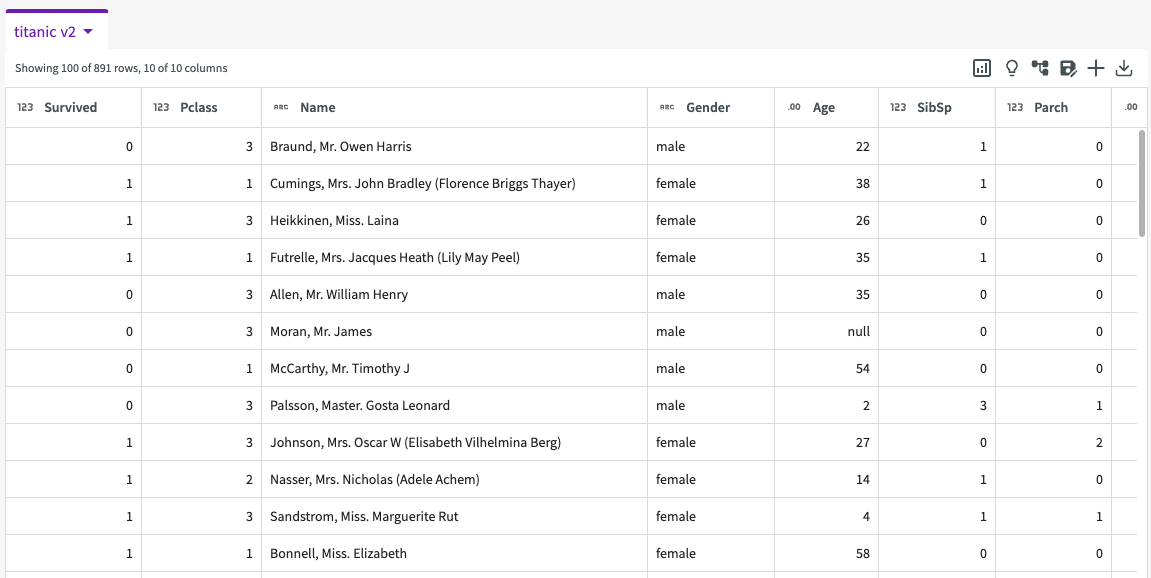
Select "PassengerId" and "Ticket".
-
Click Submit.
The new dataset "titanic v2" doesn't include the dropped columns.
Let's also compute the average ticket cost based on a passenger's class.
-
Click Aggregate > Compute in the skill menu.
-
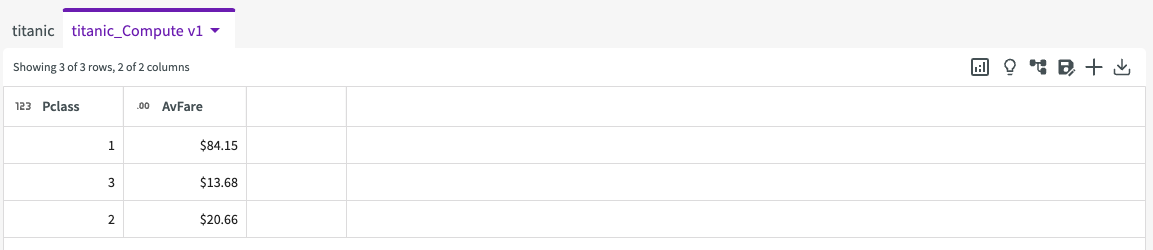
Select "average" for the aggregate, "Fare" for the column, "AvFare" for the new column name, and "Pclass" for columns to group by.
-
Click Submit.
The new dataset "titanic_Compute" appears.
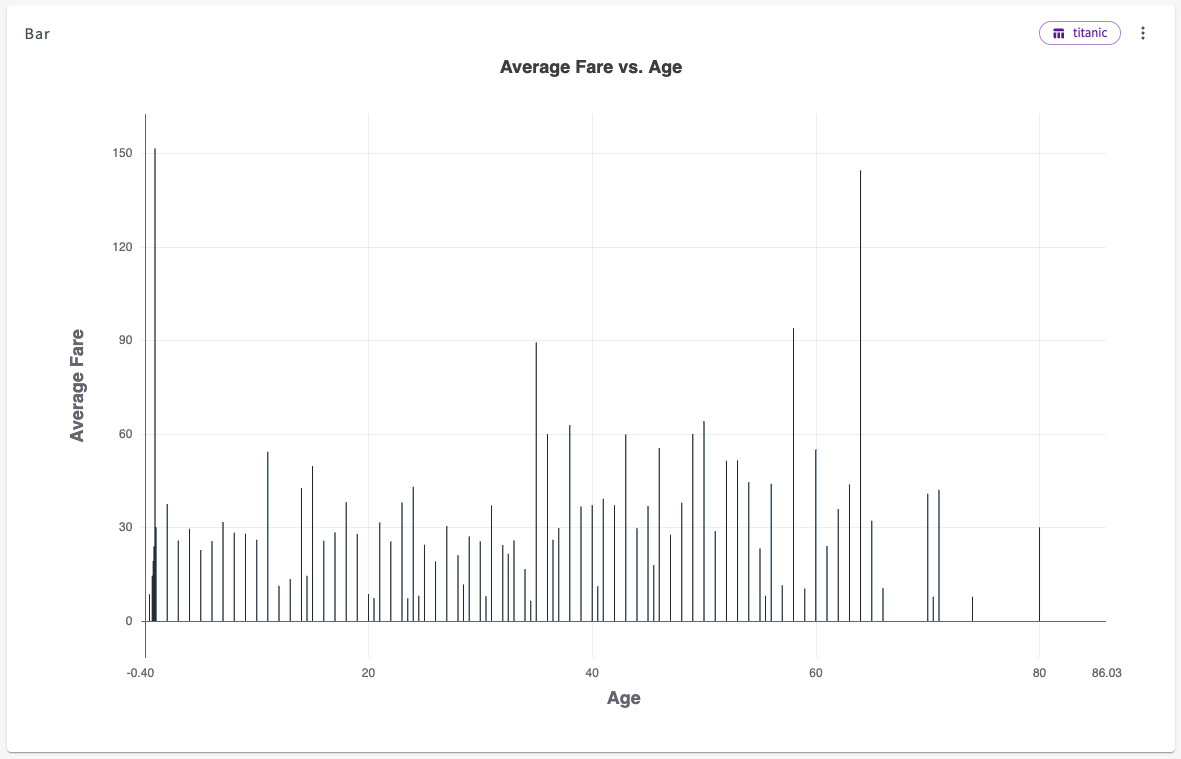
Finally, let's create a chart to visualize ticket cost.
-
Select the "titanic v2" dataset.
-
Click Plot Chart in the skill menu.
-
Select "Bar Chart" for the type, "Age" for the X-Axis, and "Fare" for the Y-Axis.
-
Click Submit.
The new chart appears in the Chart tab.
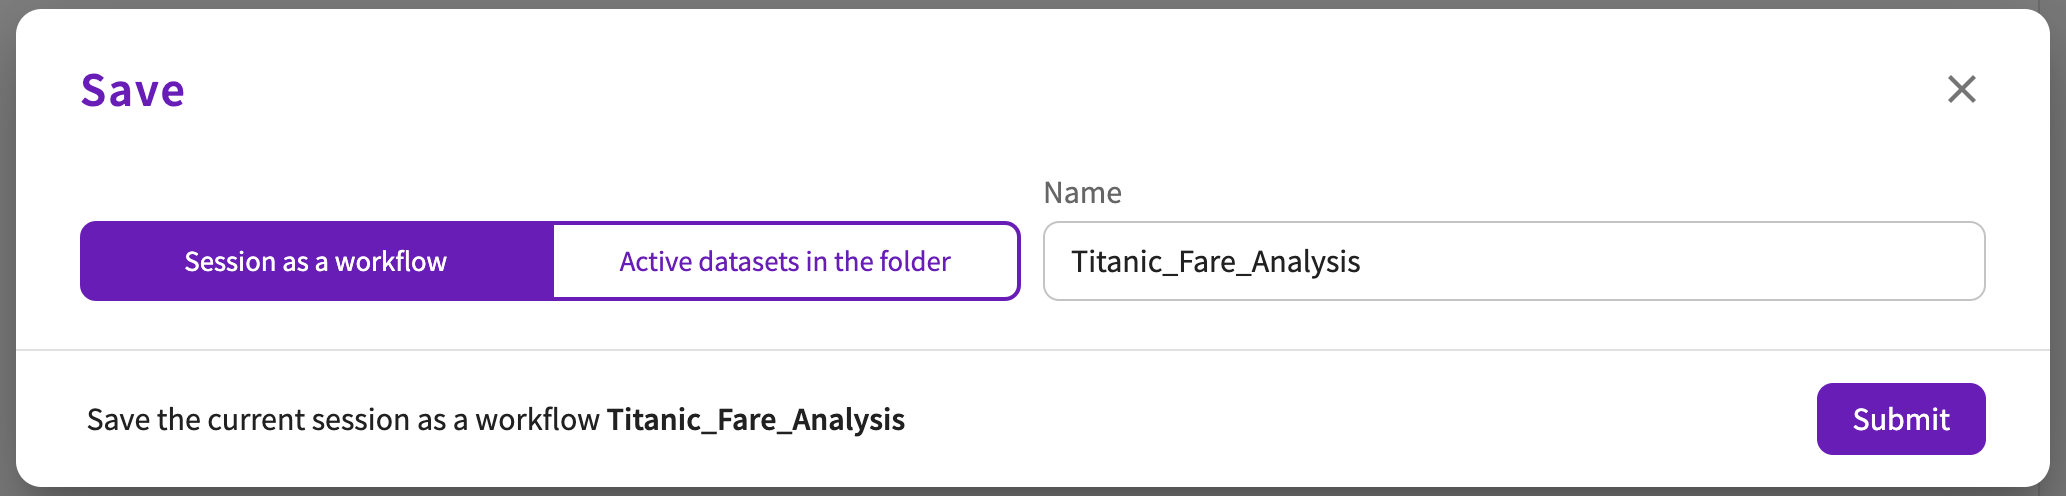
Save Session as a Workflow
Let's save our session as a workflow. Navigate back to the Data tab and click Save in the skill menu. Select Session as a workflow, and enter the name "Titanic_Fare_Analysis". Click Submit.
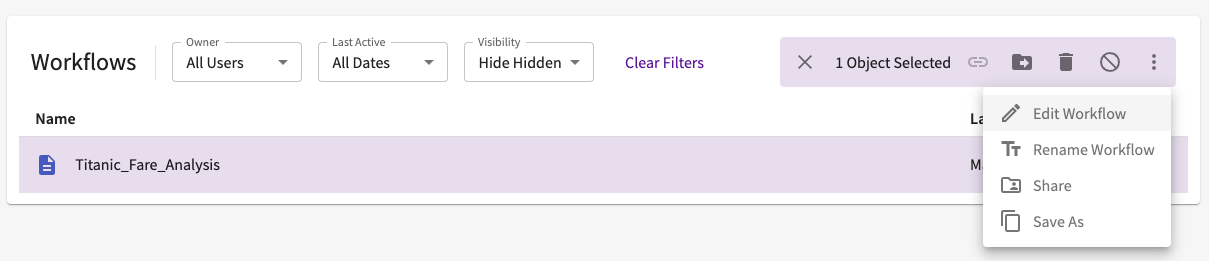
Edit a Workflow
Let's say we'd like to edit our workflow. Navigate to the homepage and select "Titanic_Fare_Analysis" from either the My Work or Workflows section. Click Edit Workflow to open the Editor.
The Editor shows each step taken on the datasets within our session and allows you to add, remove, or edit your steps.
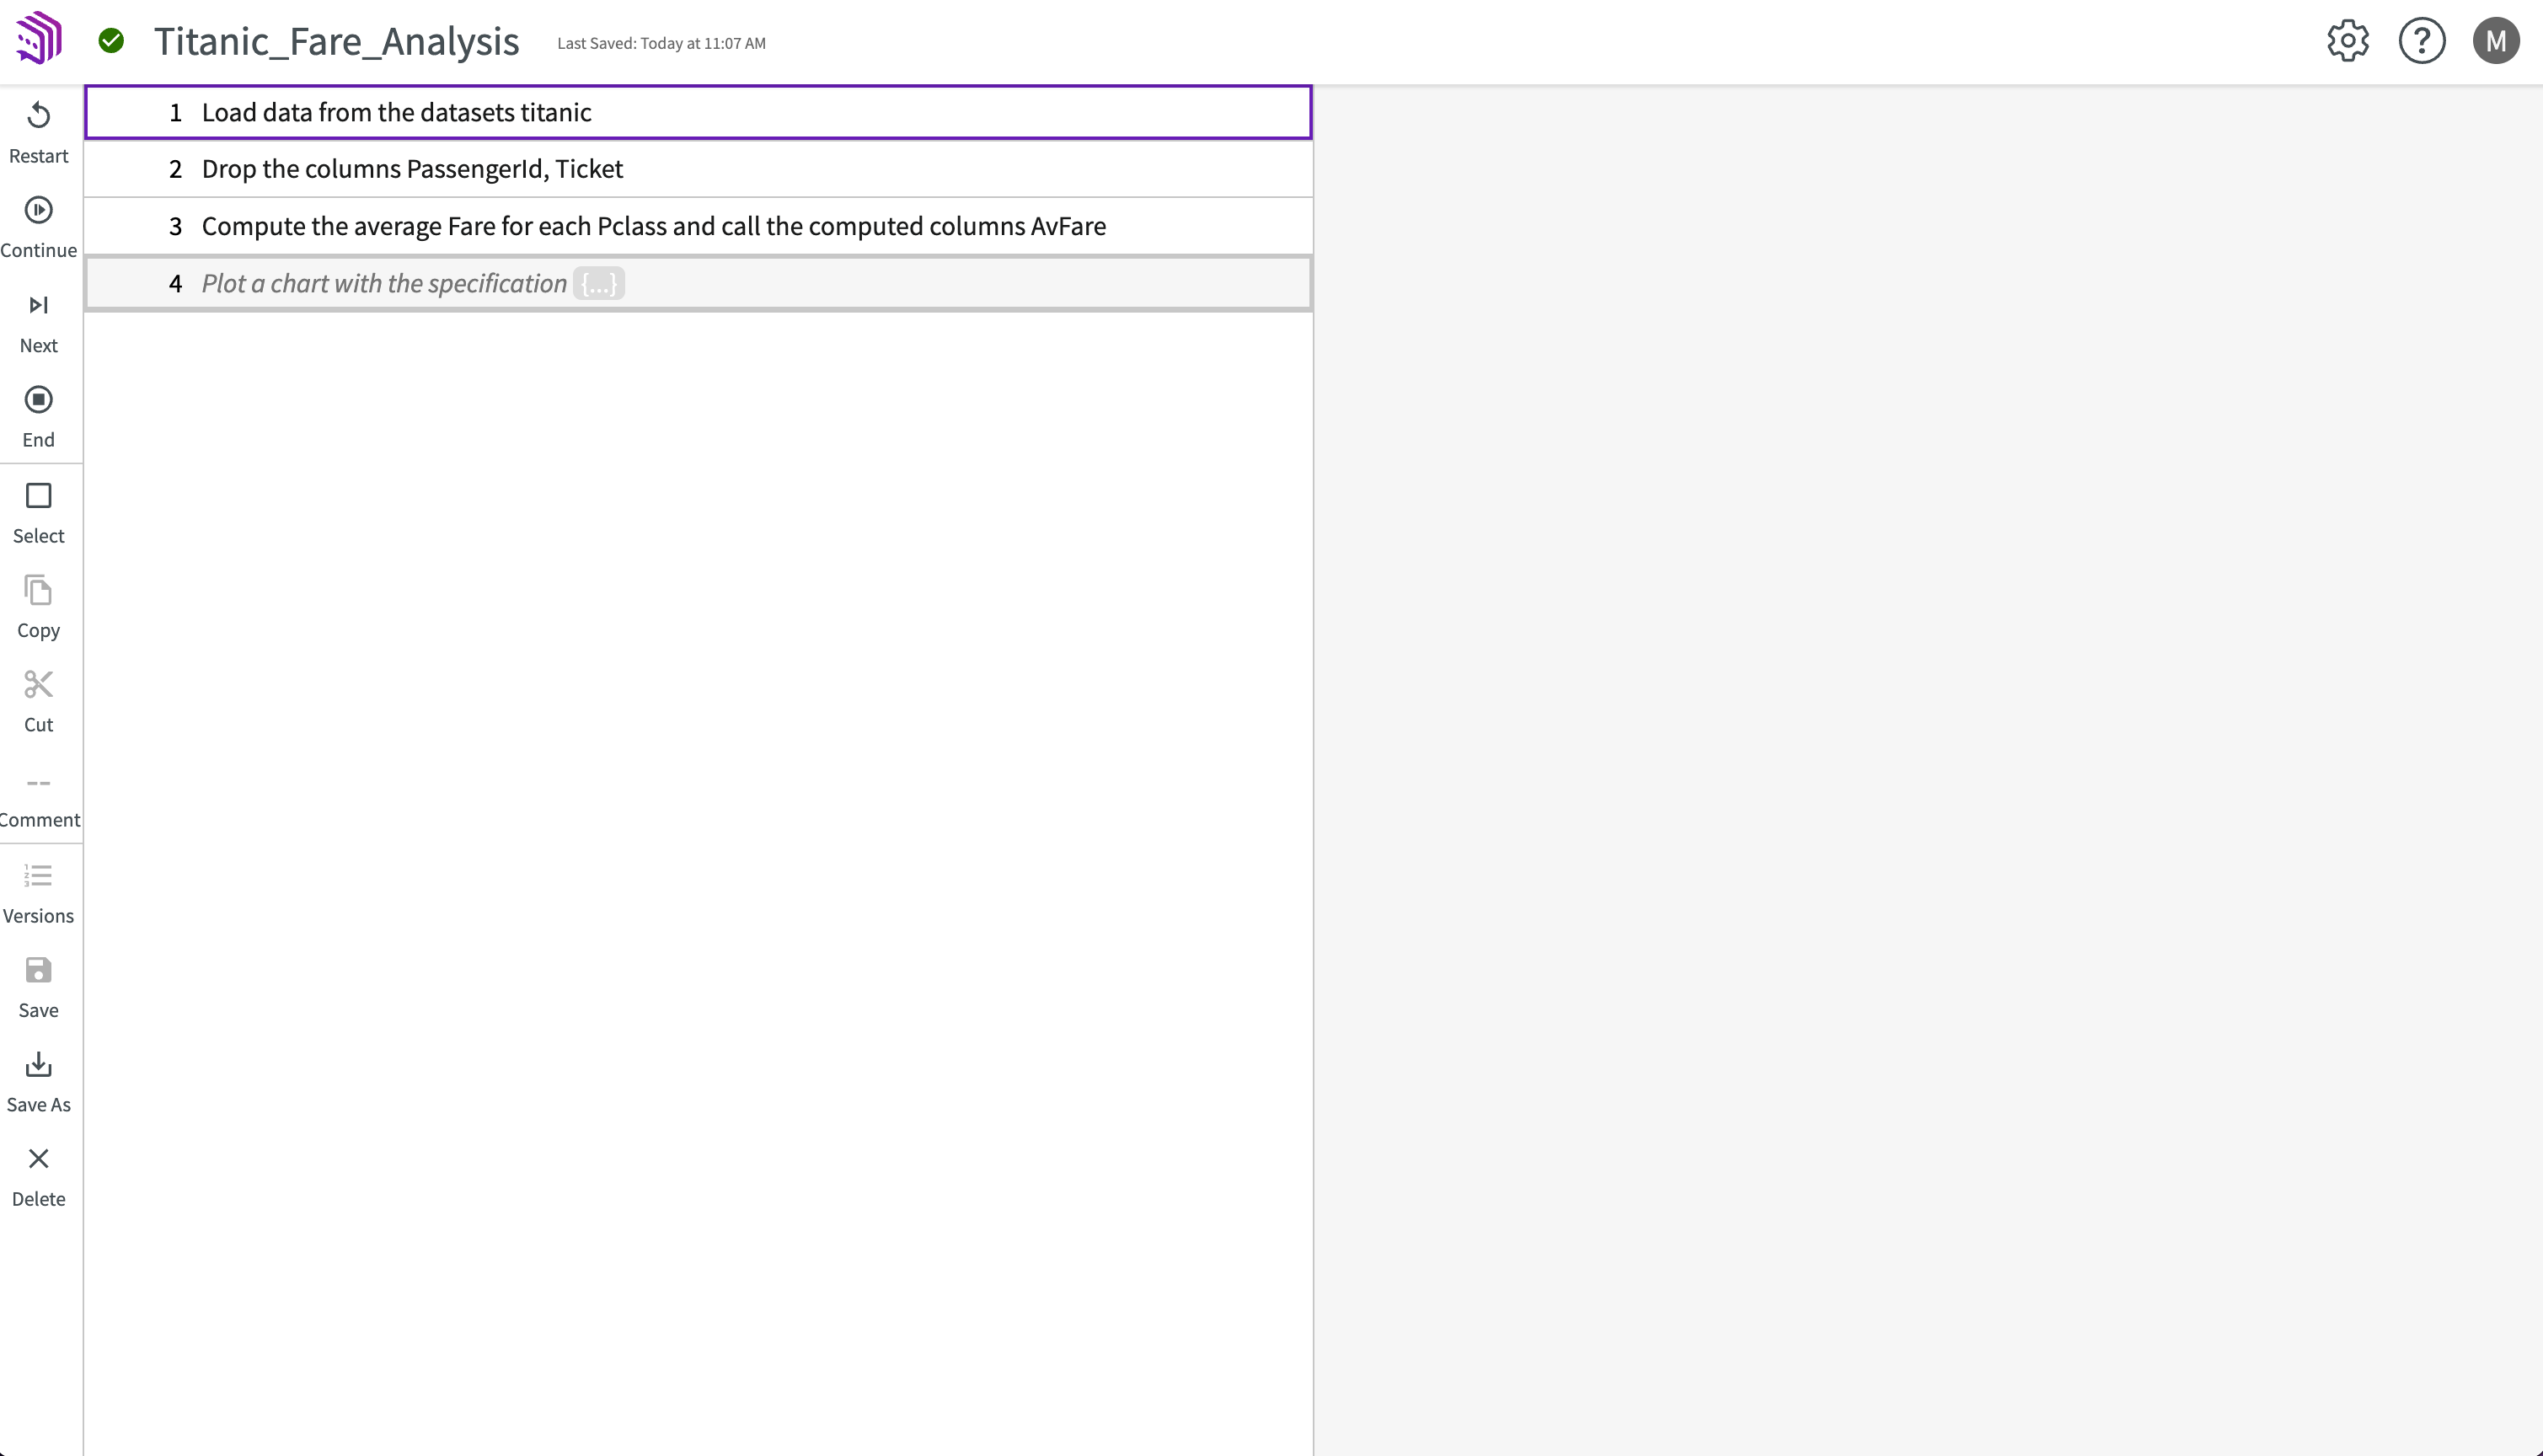
Let's add an additional computation to show the number of records where Fare is greater than $75. From the Editor, we'll click on the third line, Compute the average Fare for each Pclass and call the computed columns AvFare, then click Enter to create a new line beneath it. Then, we can enter Compute the count of records where Fare is greater than 75.
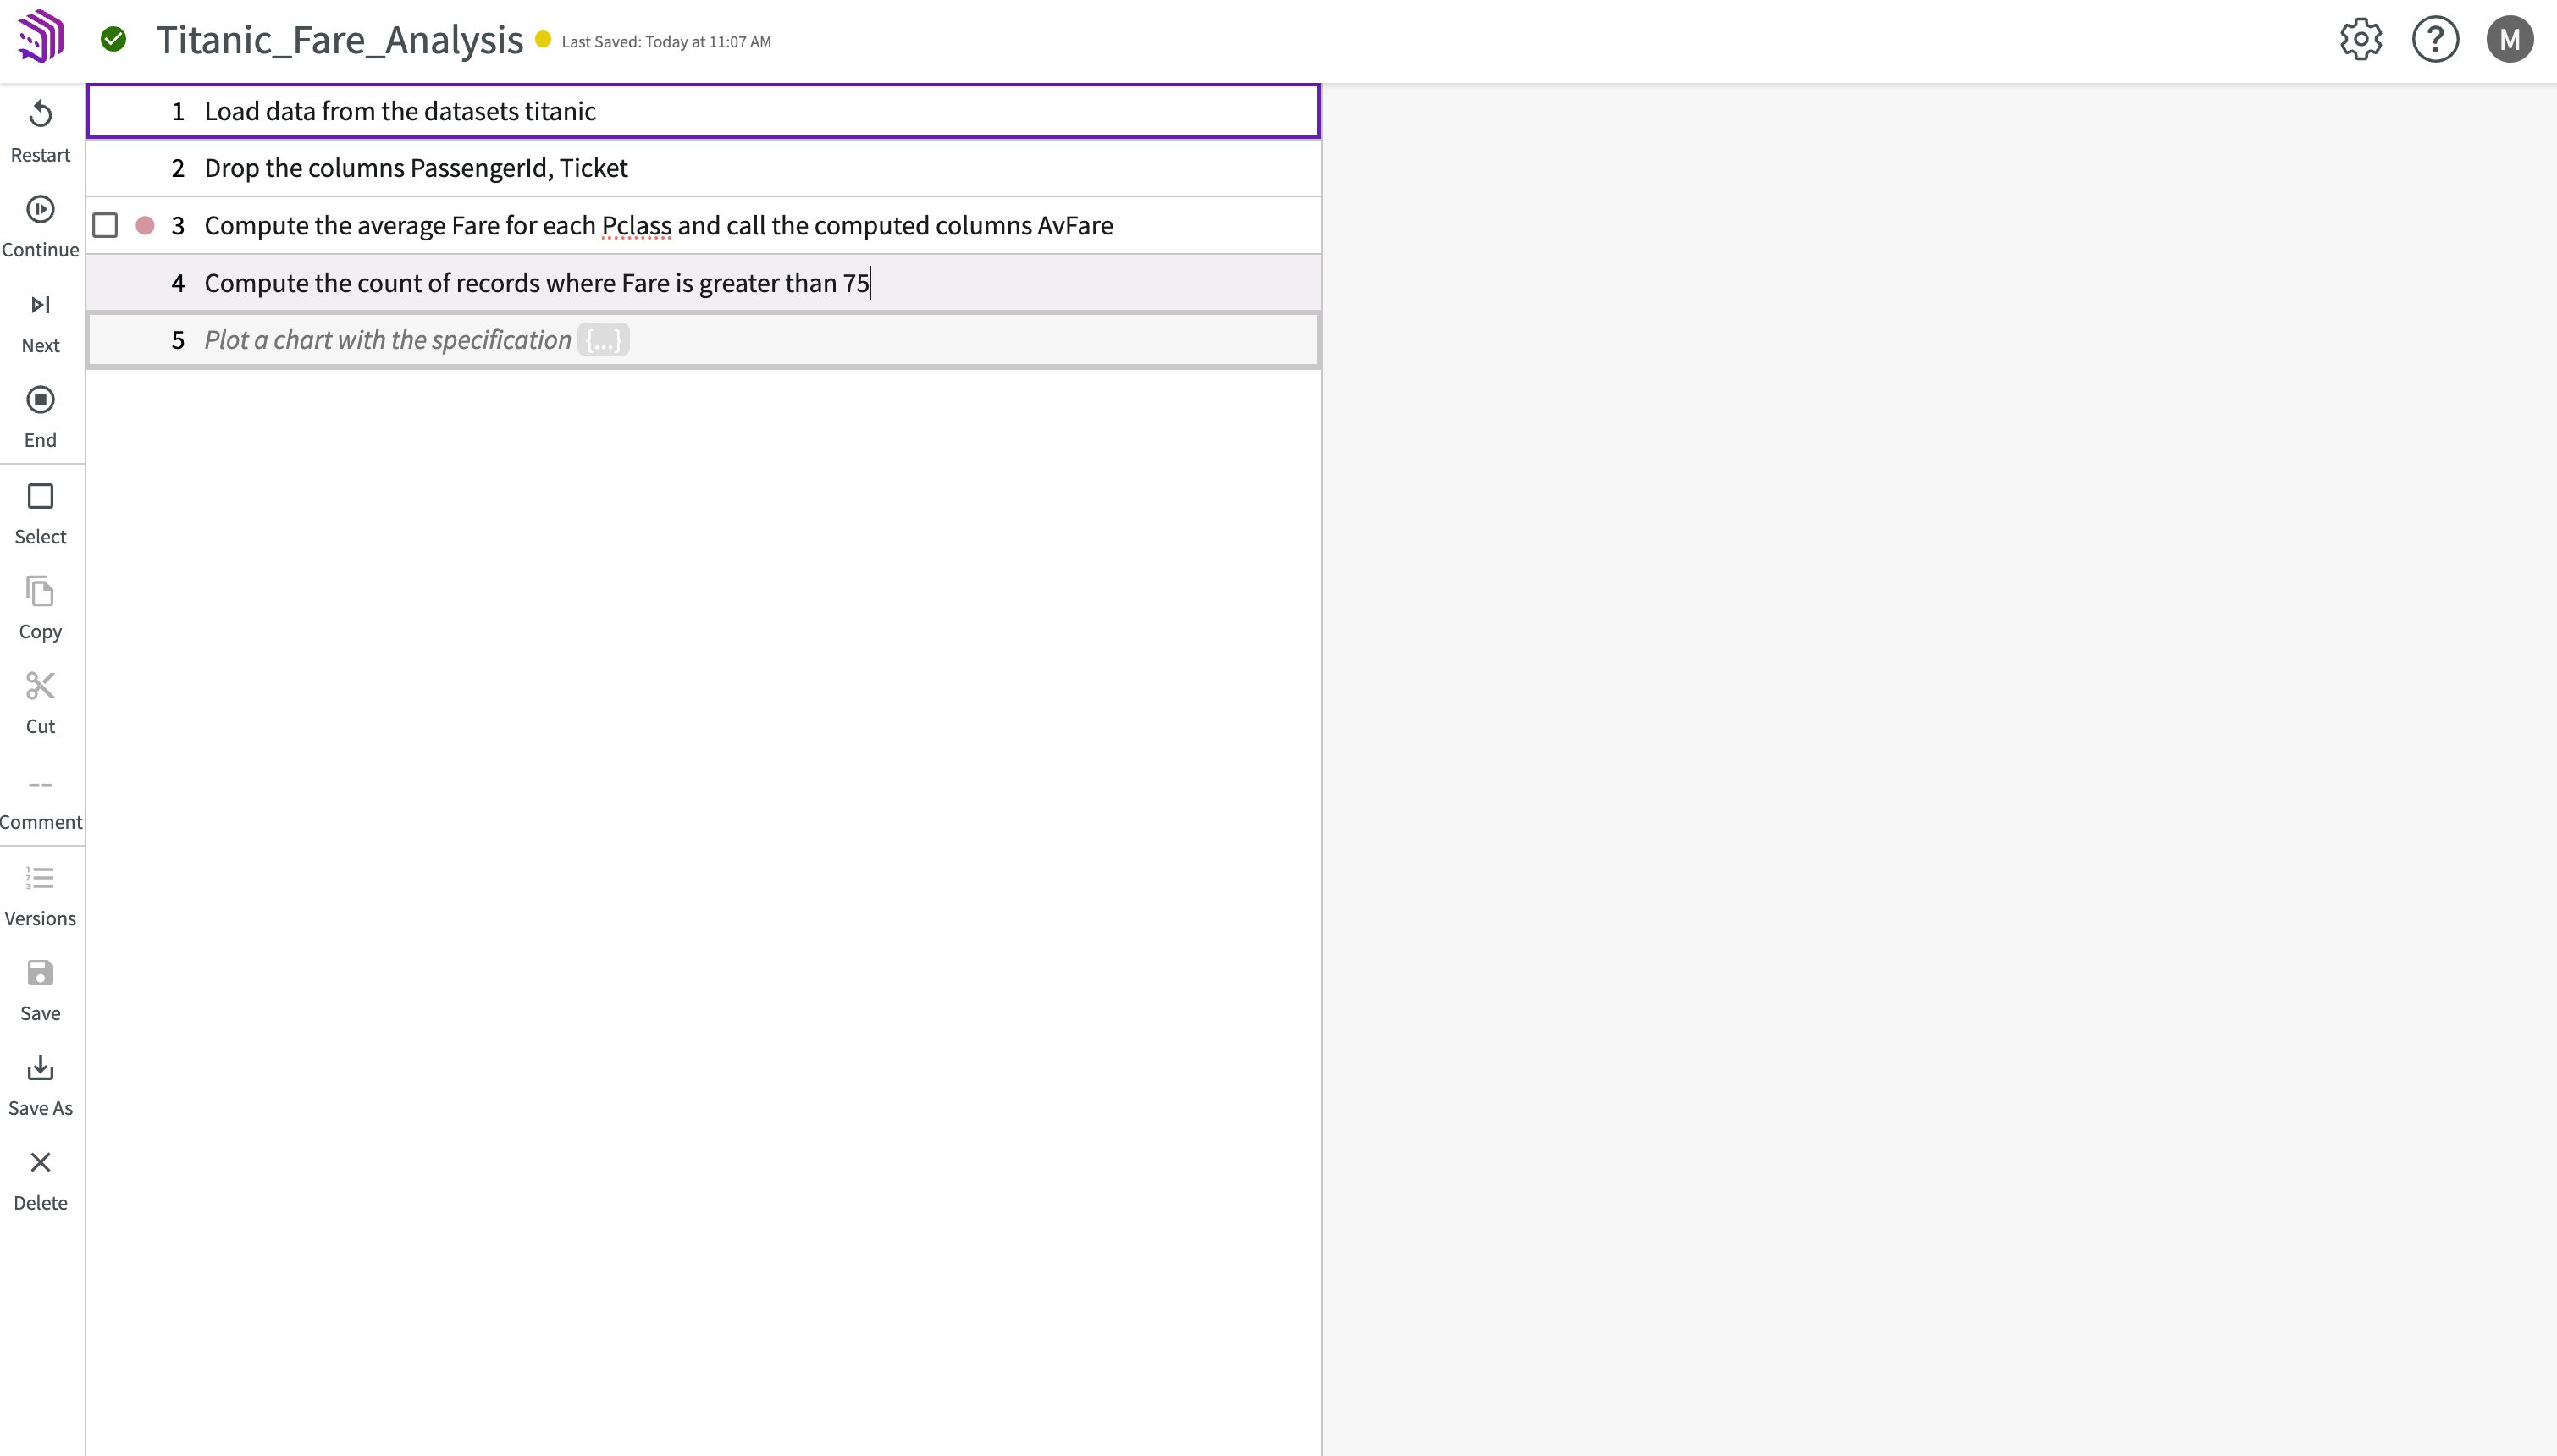
The edited workflow needs to be tested to ensure it's valid. Click Replay > Continuous in the sidebar. The entire workflow is run, and the results of each step appear in the Workflow Editor replay panel.
The green check to the left of the workflow name indicates that the edited workflow replayed successfully.
![]()
Share a Workflow
Now that we've edited the workflow, let's share it with another user in our organization. From the homepage, right-click on the workflow "Titanic_Fare_Analysis" in the My Work or Workflows section, and click Share. Enter the name of a user in your organization, select whether the user should be a Viewer or an Editor, and click Save.