Guided Learning
This guide walks through data preparation and cleaning in DataChat using bookstore inventory data from India. We'll investigate how book lengths and categories contribute to book prices (৳), which can later be used to decide which books to market to consumers.
Load Data
First, download the "Bookstore Inventory: Best Sellers and New Releases" dataset. Extract the .zip folder and upload the .csv file into DataChat.
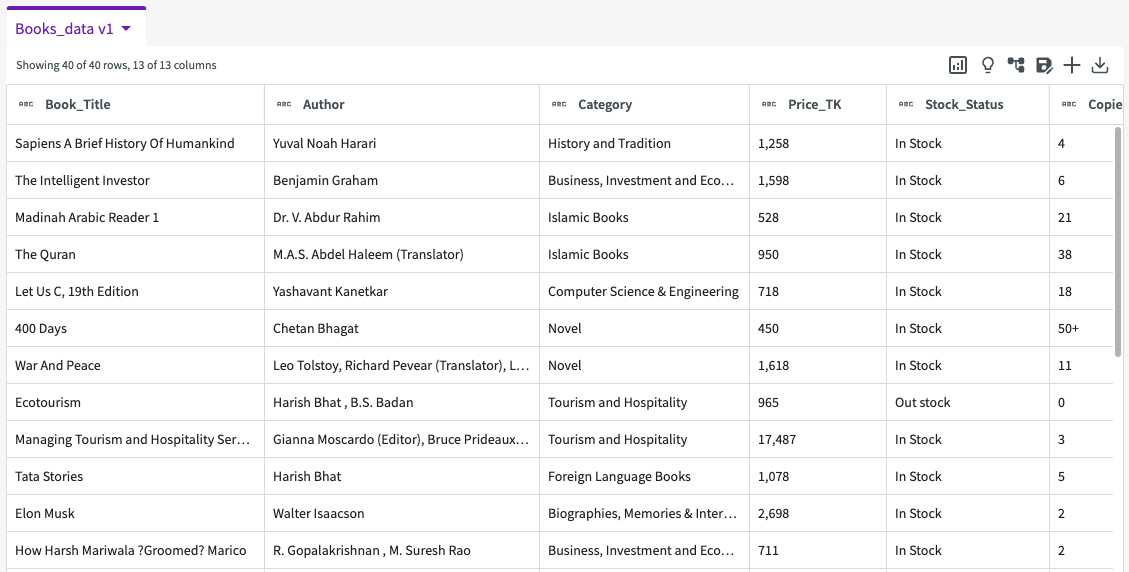
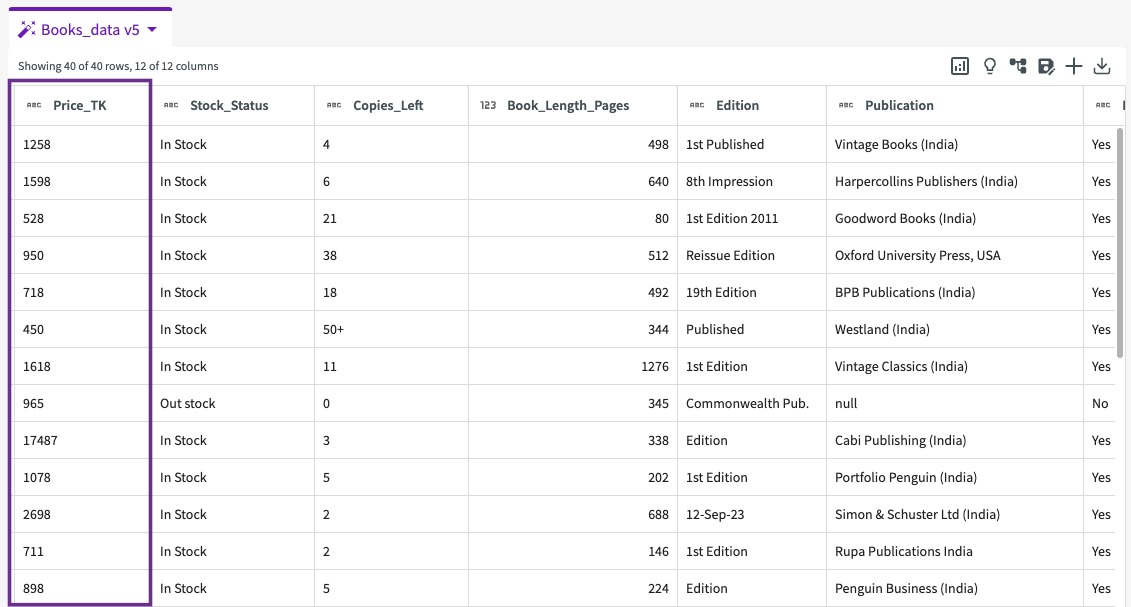
Our dataset should look like something like this:
Explore
Exploring data helps you to understand its types, quality, and statistics.
View Summary Statistics
To view summary statistics, click Show Descriptive Statistics in the table header.
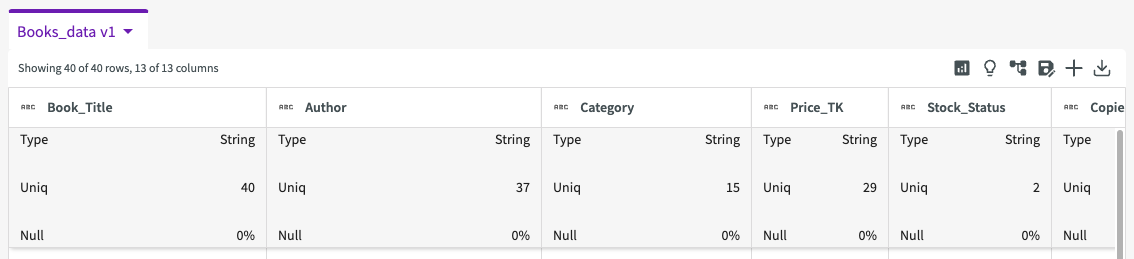
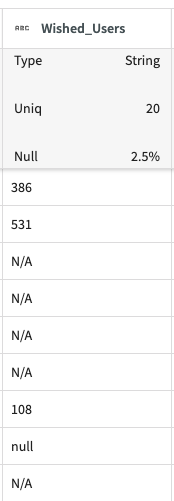
The table provides some useful details about our data. We can see that most of our columns are of string type, except "Price_TK", "Copies_Left", and "Wished_Users". We can also see that a couple of our columns, such as "Wished_Users", "Ratings", and "Reviews", have null values to address. If we look closer, the "Wished_Users" column uses both "null" and "N/A" as null values for a majority of rows:
Prep and Clean
Let's prepare and clean our data so that we can focus only on the pieces relevant to our analysis. In this case, we're mainly focused on prices, categories, and page counts.
Remove Nulls
Because the "Wished_Users" column is comprised of mostly null values, we won't want to use it in our analysis. We can drop this column by clicking the More menu in the column header, followed by Drop.
From here, we can also replace nulls in the "Ratings" and "Reviews" columns with their corresponding averages. Ask the Data Assistant to "Remove null values in the Ratings column by replacing it with the average". The Data Assistant returns a dataset with the replaced null values:
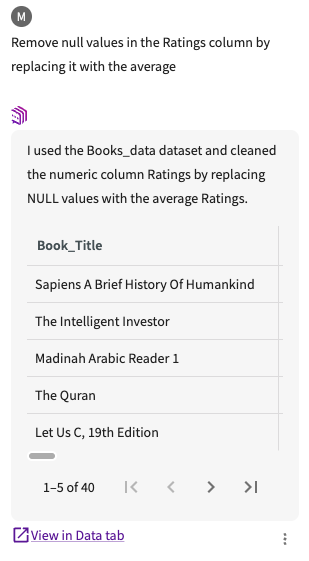
Click View in Data tab to add it to our existing datasets.
Similarly, let's also ask to "Remove null values in the Reviews column by replacing it with the average".
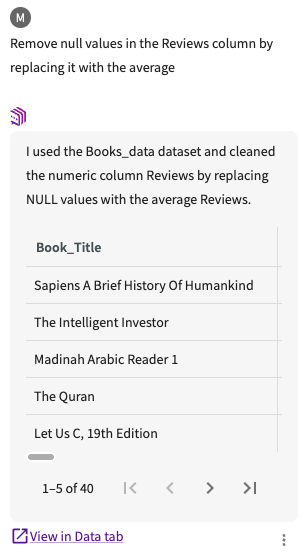
Click View in Data tab to add it to our existing datasets.
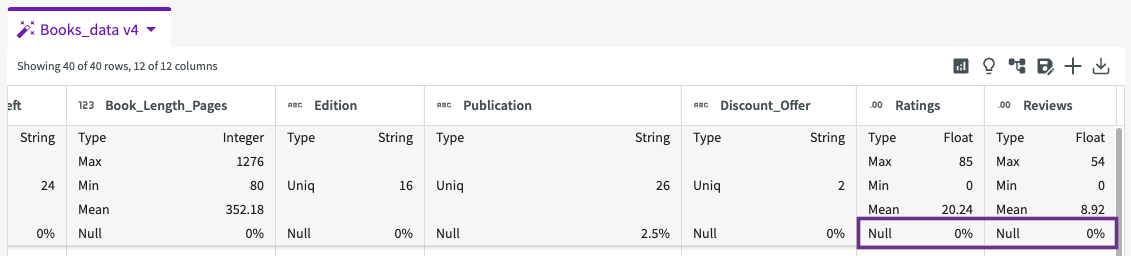
Our dataset is now version 4, and the "Ratings" and "Reviews" columns no longer have any null values.
Change Column Types
While exploring our data, we noticed that some of our numerical value columns were labeled as string type. Let's change the "Price_TK" column to integer type so that we can perform analysis with it later. Before changing the type, we must first remove the thousands separator (comma) from the values in this column.
In the Data Assistant, ask "Clean the column Price_TK by removing commas". The Data Assistant returns a dataset with the commas removed from the values:
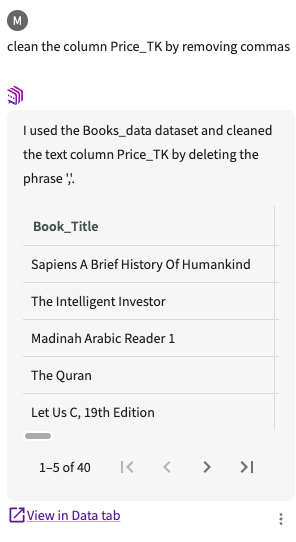
Click View in Data tab to add it to our existing datasets.
From here, navigate to the column header and click the More menu > Change Type > Integer to change the column's type:
Sort Data
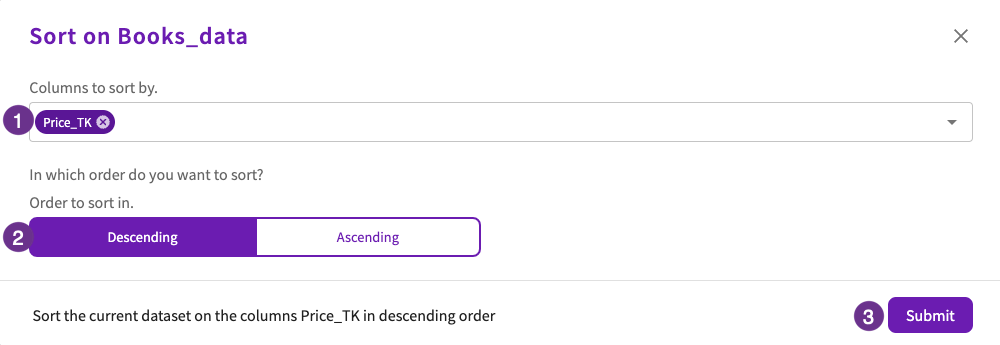
Now that our data is cleaned, let's organize it by sorting the rows in descending order based on price. This provides a more structured view of book prices. Click Wrangle > Sort, then:
- Select "Price_TK" for the column to sort by.
- Select "Descending" for the order to sort in.
- Click Submit.
The resulting dataset moves the "Price_TK" column to the front and organizes the rows based on price in descending order:
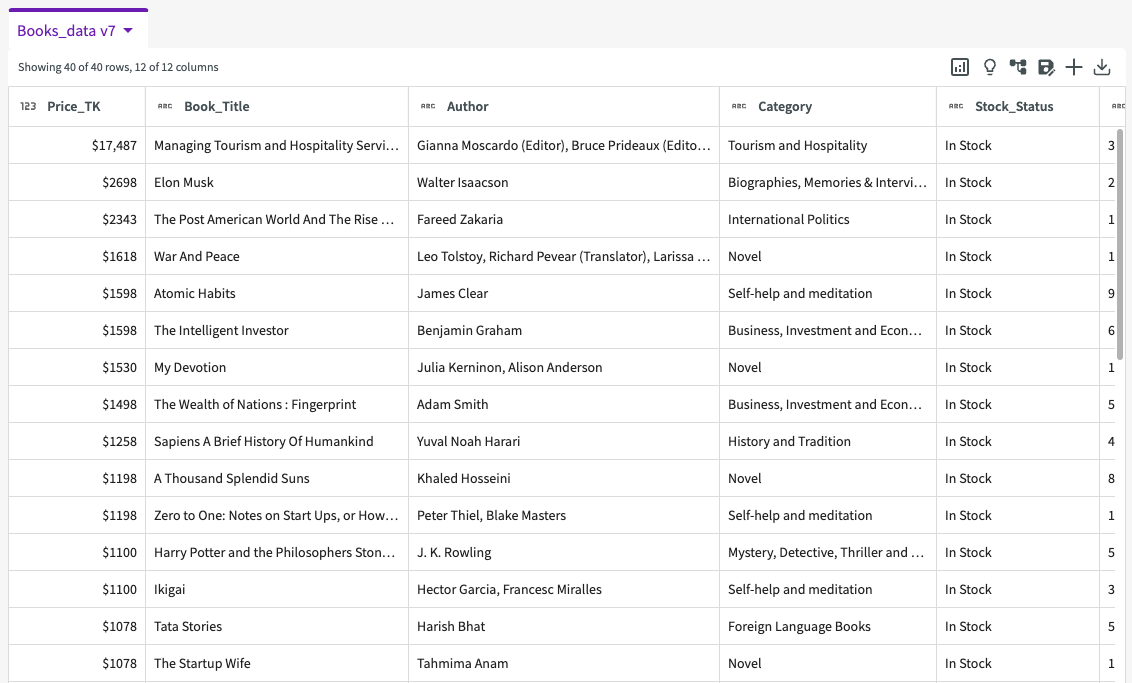
We can see that prices range from ৳150 to ৳17,497, with the maximum price being about ৳15,000 more than the next most expensive book.
Bin Columns
Now that we have an idea of what our book prices look like, let's create a binned column to put these prices into more manageable categories. In the Data Assistant, ask "Bin the column Price_TK into 5 bins based on percentile". The Data Assistant returns a dataset with an added bin column:
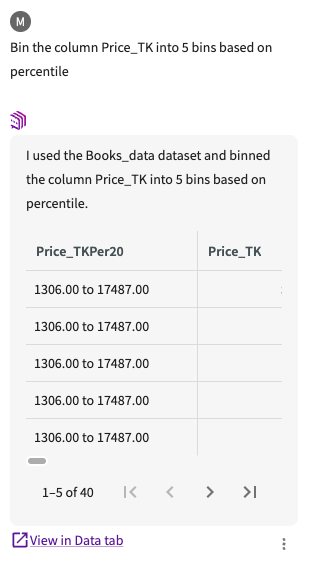
Click View in Data tab to add it to our existing datasets.
Start Analyzing
Now that our data is cleaned and organized, we can start diving a bit deeper into our analysis.
Create Pivot Tables
Let's start by creating a pivot table to view the maximum price in each price bin for each genre category.
In the Data Assistant, ask "Pivot on maximum Price_TK creating rows from Category and columns from Price_TKPer20". The Data Assistant returns a pivot table with the replaced null values. Click Add to Chart tab to view the table:
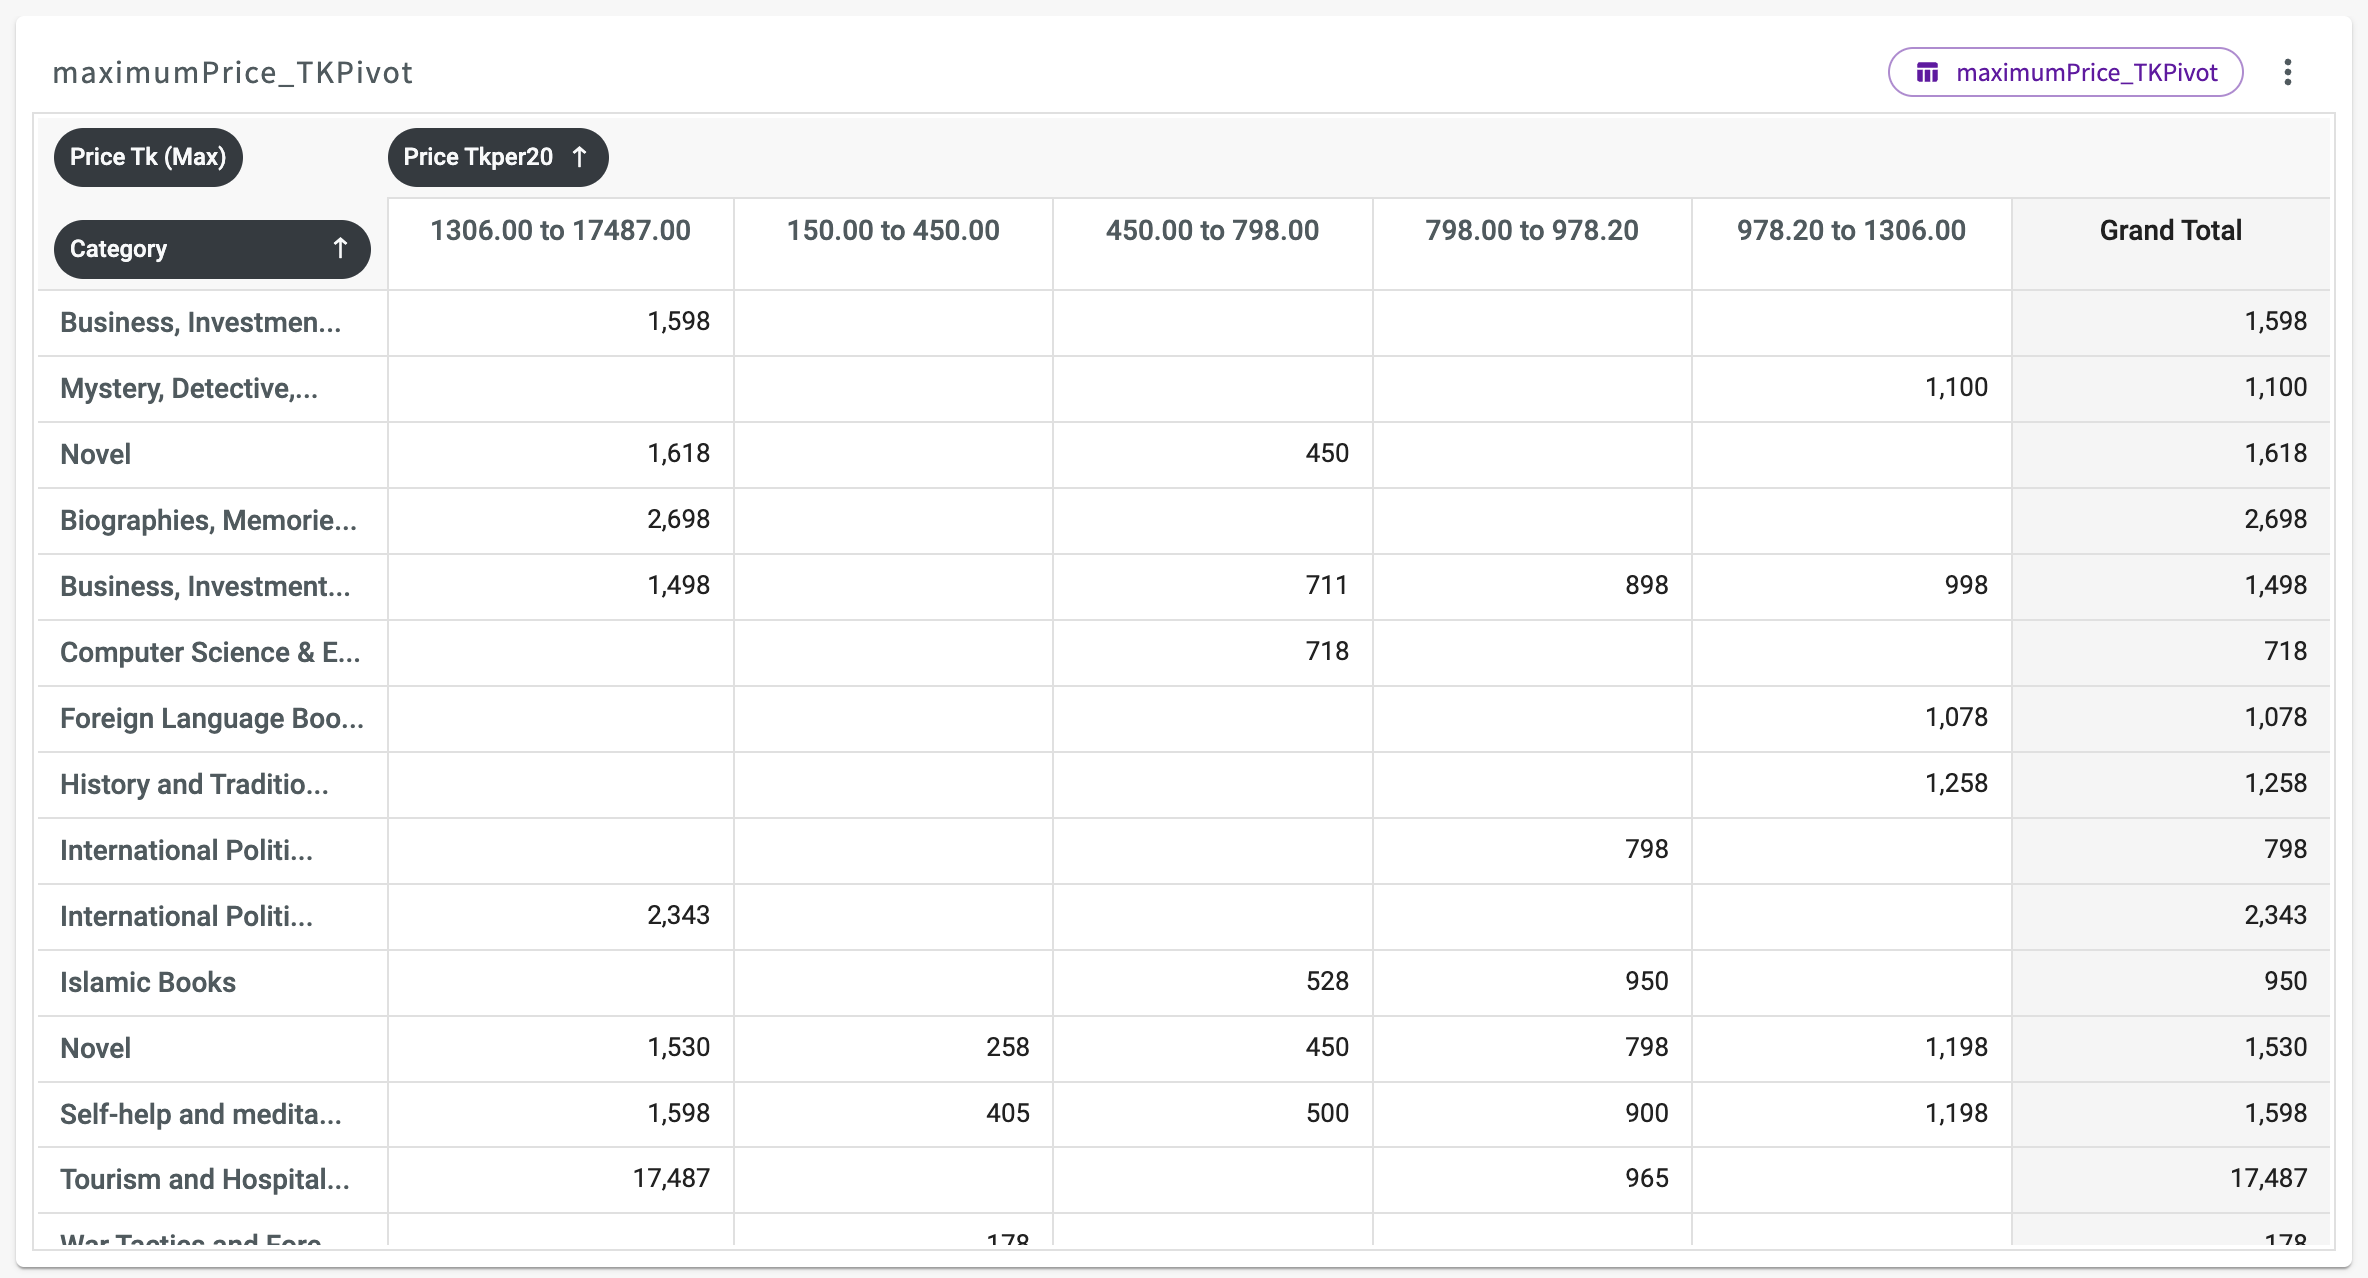
From this table, we can observe the maximum book price for each bin across various categories. By scrolling to the right, the Grand Total column reveals the highest value from each row. Notably, the categories "Tourism and Hospitality," followed by "International Politics" and "Biographies, Memoirs & Interviews," have the highest book prices.
This insight highlights the need to explore how genres relate to book prices and how to market these high-priced books effectively to consumers.
Aggregate Data
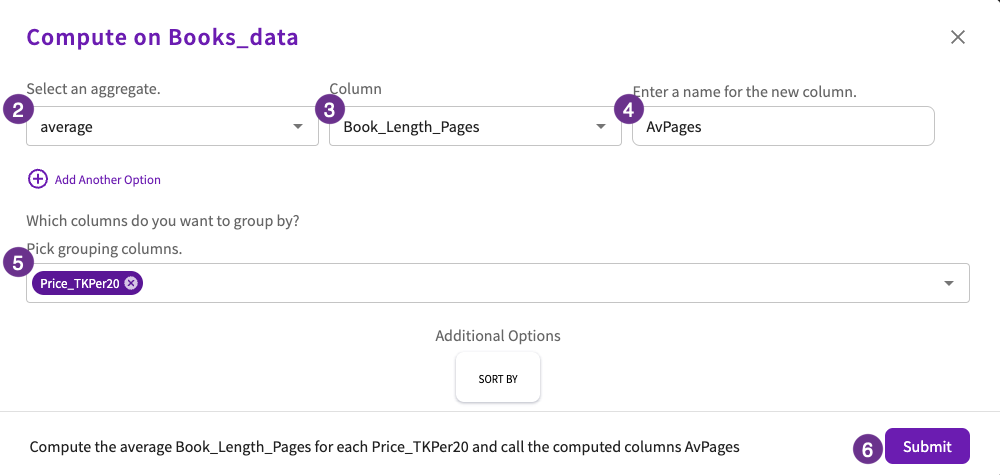
Let's also investigate how page counts might contribute to book prices. Navigate back to the Data tab, then:
- Click Aggregate > Compute in the skill menu.
- Select "average" for the aggregate.
- Select "Book_Length_Pages" for the column.
- Enter "AvPages" for the new column name.
- Select "Price_TKPer20" for the column to group by.
- Click Submit.
The results appear as a dataset:
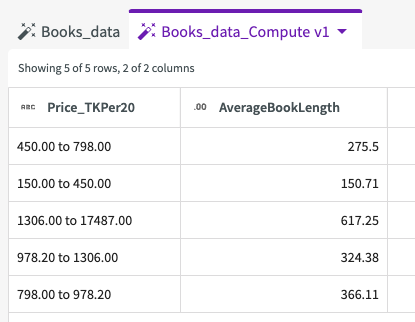
The results reveal that generally as price increases, so do the number of pages. The correlation between price and the number of pages suggests that consumers might be more willing to pay more for longer books and is something worth exploring in further analysis.