Aggregate
Aggregating helps to collect and summarize your data for analysis. You can aggregate your data in two ways:
- Using Compute to perform calculations and aggregations on one or more columns in your dataset.
- Using Pivot to create a pivot table.
note
When a skill is applied to a dataset:
- If the skill creates a new dataset, it will use the convention
[dataset]_[Skill]. - If the skill alters your existing dataset, it will use the convention
[dataset] v[x]to save to a new version.
Compute
You can use the Compute skill to perform various calculations such as averages and sums.
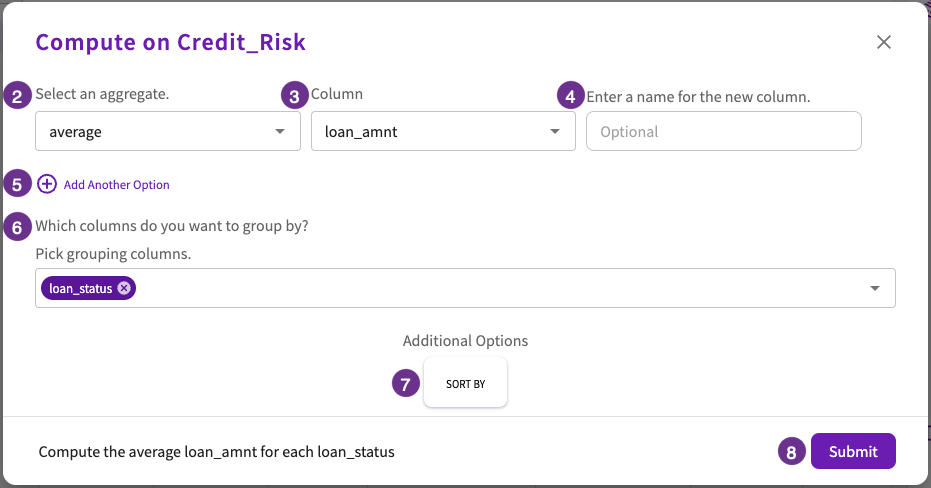
To compute an aggregation or calculation on a dataset, select the dataset to Compute, then:
- Click Aggregate > Compute in the skill menu.
- Select the aggregation you want to compute.
- Select the column you want to compute.
- Enter a new name for the column.
- Optionally, click the + button to add additional aggregations to compute, or click the - button to remove additional aggregations.
- Optionally, enter the columns to group by.
- Optionally, enter the columns or values to sort by.
- Click Submit to run the computation.

Pivot
Pivot tables quickly summarize large amounts of data. You can use the Pivot skill to create your pivot tables.
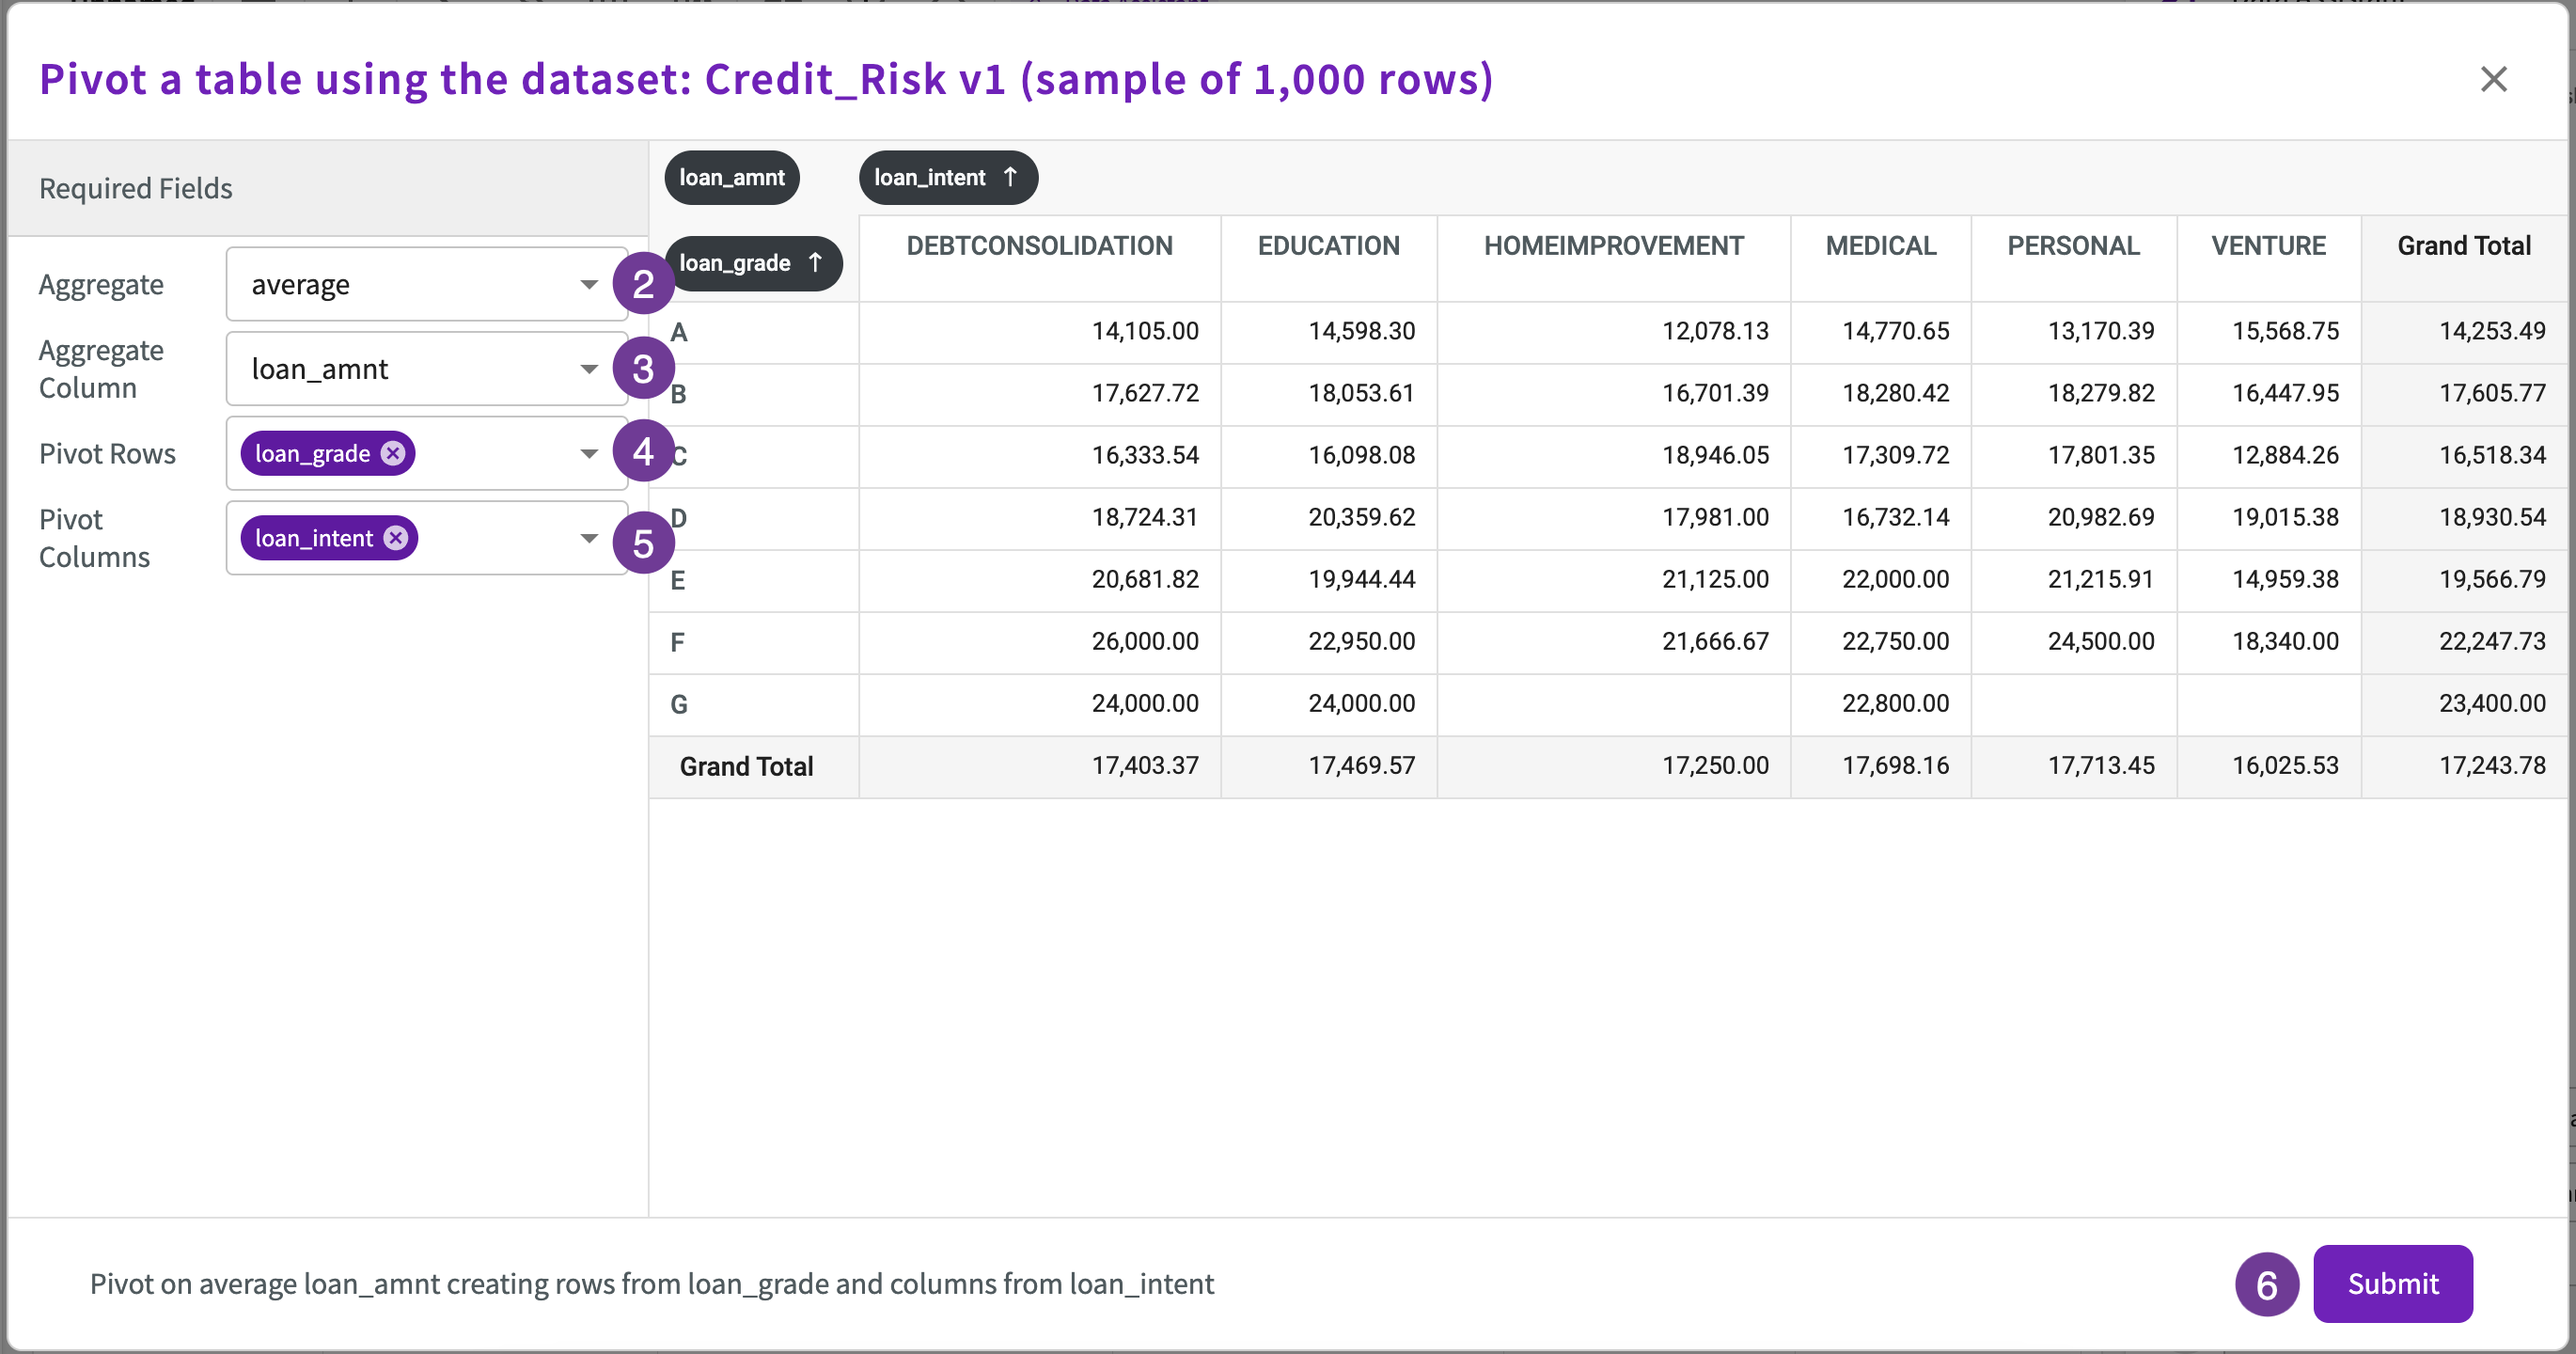
To create a pivot table:
- Click Aggregate > Pivot in the skill menu.
- Select the aggregate (such as an average) for the columns that you want to pivot on.
- Select the column to pivot on.
- Select the columns to create pivot rows from.
- Select the columns to create pivot columns from.
- Click Submit.

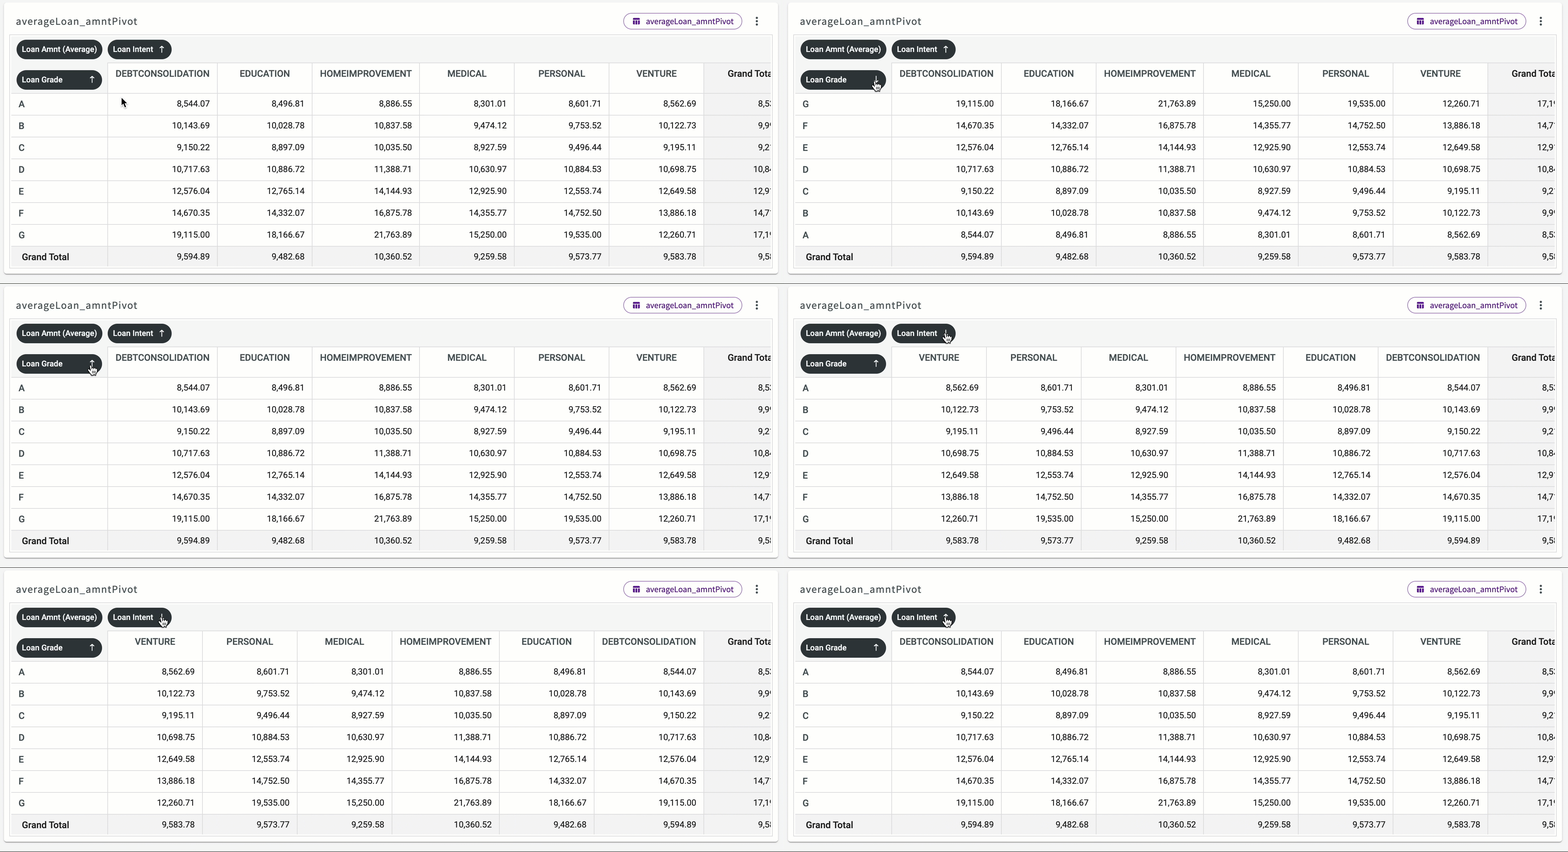
Once submitted, the pivot table appears in the Chart tab. You can sort the pivot columns and rows in ascending or descending order by clicking the corresponding arrows.
