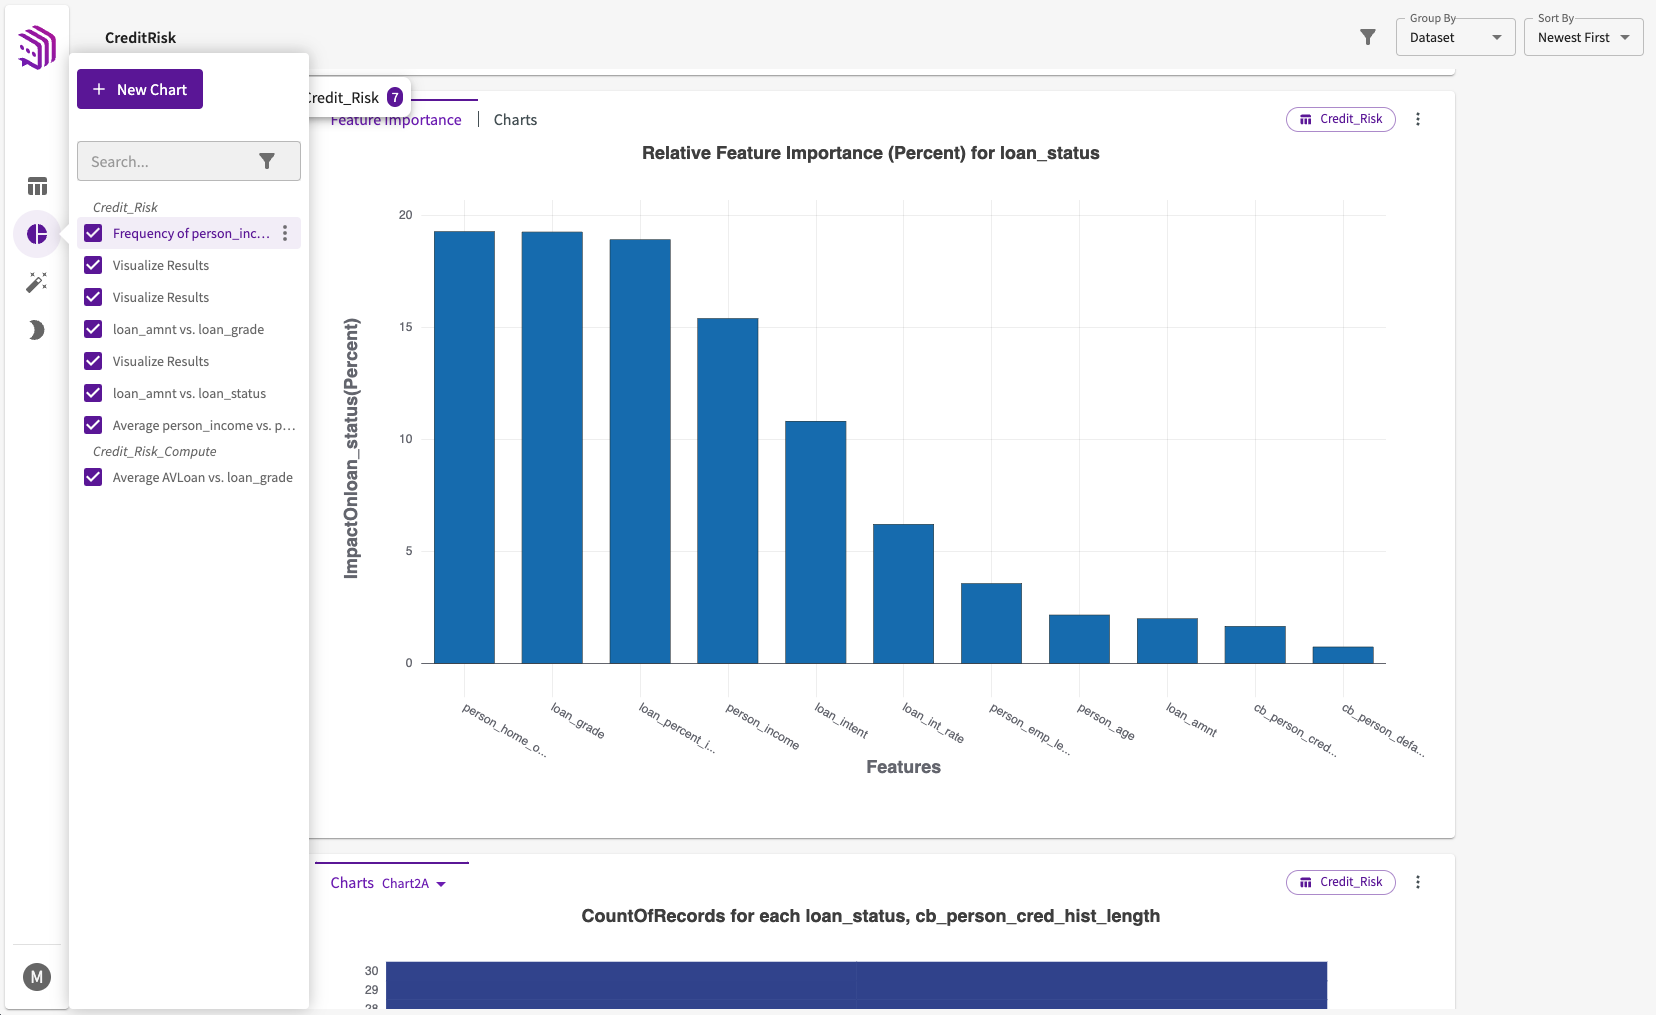
Use Charts
The charts created in DataChat are displayed in the Chart tab.
From here, you can use your charts in several ways:
- Group charts
- Sort charts
- Search charts
- Filter charts
- Hide charts
- Use sliders
- View the associated dataset
- Use the More menu to:
- Export current or all slides (for charts with sliders)
- Edit a chart
- Export a chart or chart's data
- View notes on chart data
- Publish to an Insights Board
- View in a larger window
- Pan a chart
- View a chart's lineage
Pivot tables are displayed in the Chart tab and support the many of same actions as charts. You can group, sort, search, filter, hide, view the associated dataset, view lineage, open in a larger window, and publish pivot tables to an Insights Board.
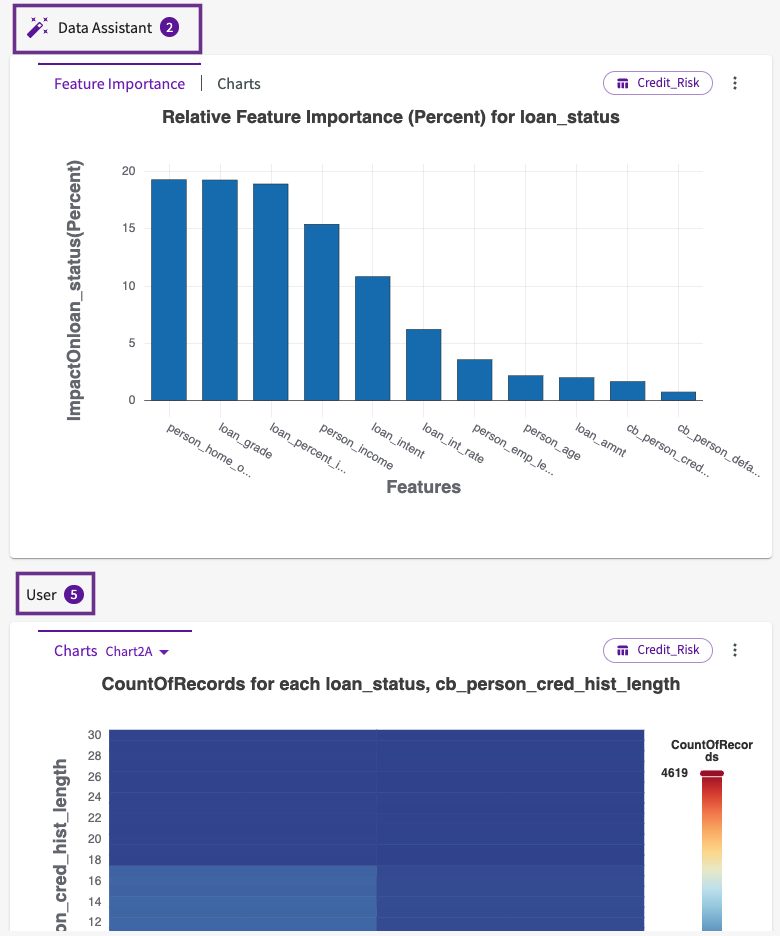
Group Charts
By default, charts have no groups. You can use the Group By dropdown on the top right of the Chart tab to change the grouping:
- None
- Dataset (the dataset used to create the chart)
- Source (the original creator of the chart, either the user or Data Assistant)

Charts are then grouped together. Each group title also displays the number of charts belonging to that group:
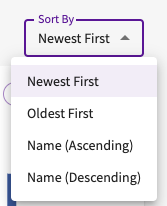
Sort Charts
By default, charts are sorted by newest first. You can use the Sort By dropdown on the top right of the Chart tab to change the sort order:
- Newest First
- Oldest First
- Name (Ascending)
- Name (Descending)
Search Charts
You can search for specific charts using the menu to the left of the charts by simply entering the parameters to filter for in the search bar. Note that the filters only apply to the chart names.
Filter Charts
You can apply a filter your charts, either by the underlying dataset or the creation source, in two ways:
- Click the filter icon in the top right of the Chart tab.
- Use the menu to the left of the charts and click the filter icon in the search bar.
Choose the filters you want to apply. They are then automatically applied. The numeric badge next to the filter icon indicates the number of active filters. To remove a filter, simply deselect it.
Hide Charts
You may want to hide certain charts from view that aren't relevant to your analysis or not immediately essential for presentation.
To hide a chart:
- Hover over the Chart tab
- Choose the charts you wish to hide from the list of available options by deselecting them.
Use Chart Sliders
If your chart has a slider, you can select the play button to view how the chart changes between each slider value.
Zoom In or Out
You can zoom in on a chart by clicking and dragging over a specified area. To zoom back out, simply double-click.
View the Associated Dataset
Each chart has a dataset label on the right side of the chart header, indicating which dataset was used to create the chart. Clicking on this label opens the dataset in the Data tab.

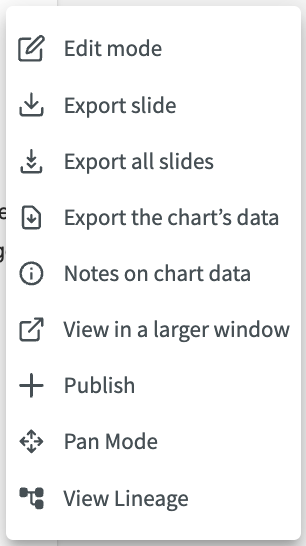
The More Options Menu
The More options menu opens a dropdown of different options you can use on your chart. In descending order, you can:
- Edit a chart
- This option opens the Chart Builder in Edit mode.
- Export slide or all slides (for charts with sliders)
- These options exports the current slide as a .png file or all slides as .zip file.
- Export a chart or chart's data
- These options export a chart as a .png file or the data used to create the chart as a .csv file.
- View notes on chart data
- This option reveals notes regarding bad/missing data from the dataset used to create the chart.
- View in a larger window
- This option opens your chart in a larger window.
- Publish
- This options opens a form to select which Insights Board to publish to.
- Pan Mode
- This option allows you to pan around on certain areas of a zoomed-in chart to view them in more detail.
- View Lineage
- This option opens a window displaying the chart's workflow.