Outlier Detection
In DataChat, you can quickly detect outliers and cycles in your data using the Chart Builder.
Detect Outliers with Visualizations
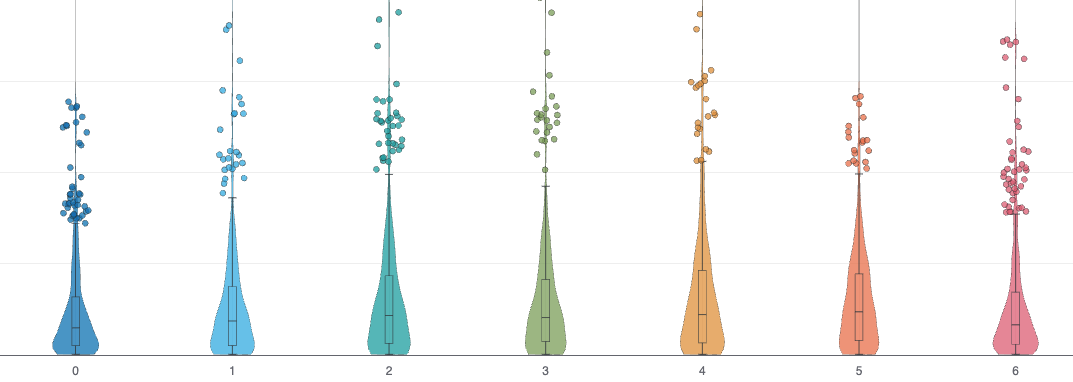
One of the quickest ways to detect outliers is to use the Chart Builder to create a violin chart. Violin charts illustrate the distribution of the values in one column in your dataset for each value in another column. Outliers are shown as dots: