Edit Charts
To edit charts, navigate to the Chart tab.
Edit an Existing Chart
After creating a chart, you might want to make some changes. For example, you might:
- Change the chart type.
- Change the axis values.
- Adjust the size of all the fonts at once.
- Change the main title and axis titles.
- Adjust the font size of the chart's main title, axis titles, axis labels, annotations, and text.
- Change the colors used in the chart.
- Add text to the chart.
- Add annotations and arrows to help call out important observations.
- Change the size of the markers in line, scatter, and stacked area charts.
- Change the contents of an annotation.
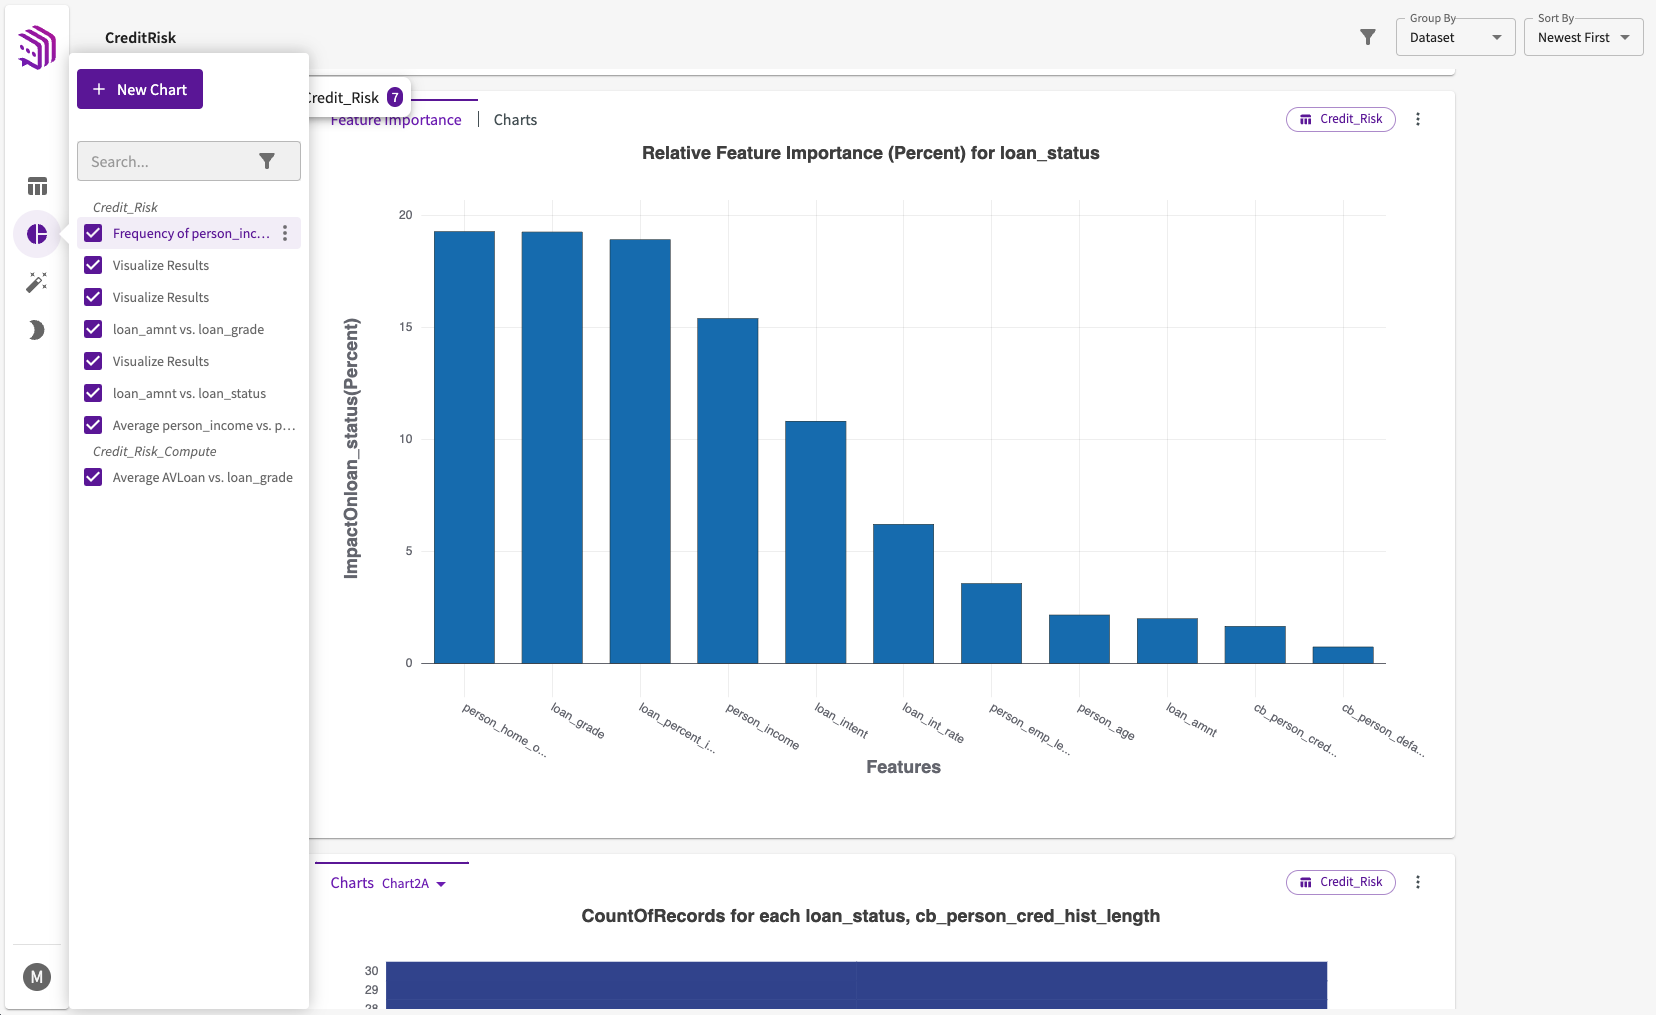
To edit a chart, click the More options menu from the chart header, then select Edit mode.
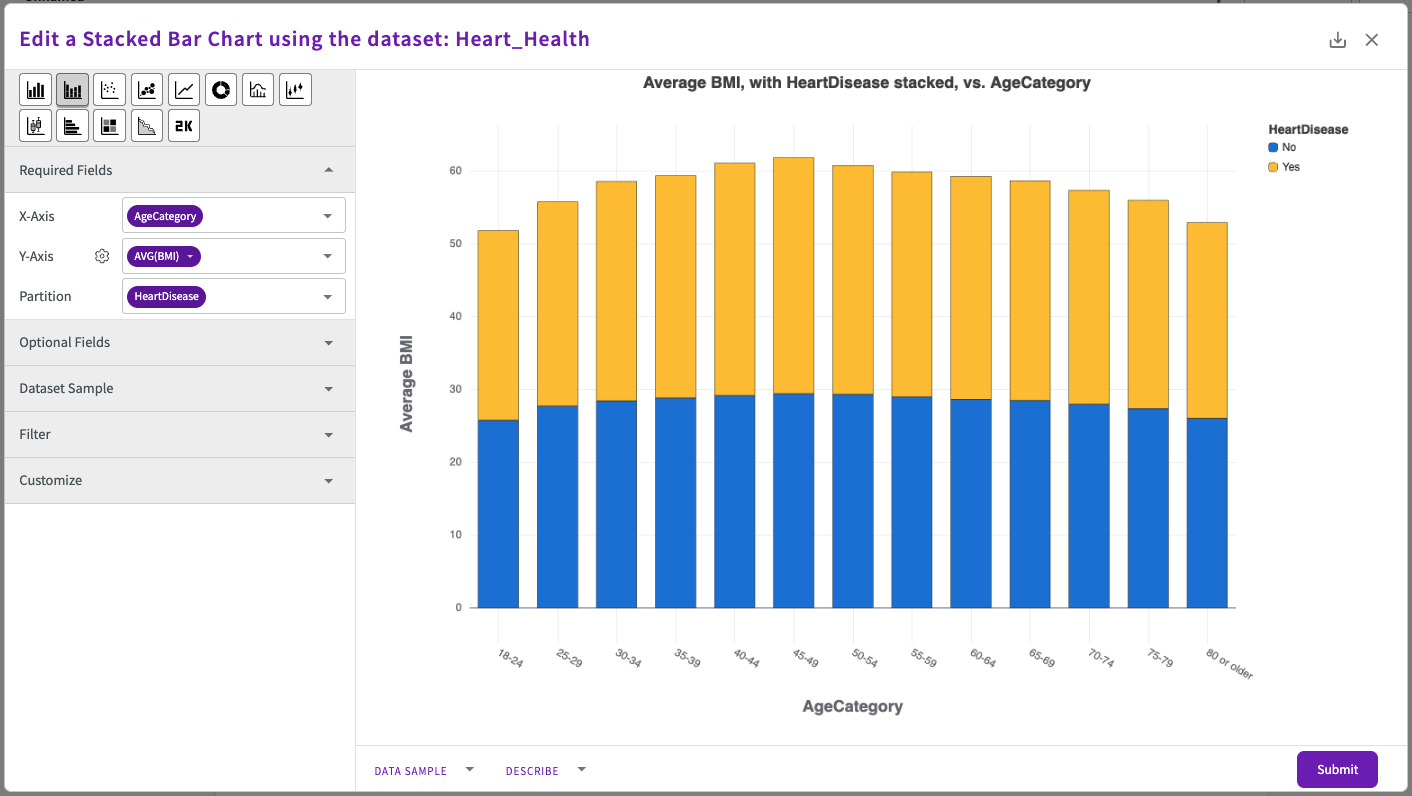
Edit Mode
Edit mode reopens the Chart Builder, where you can make your desired edits. Refer to the Create a Chart section for more information.
Non-Editable Charts
Edit mode is unavailable for the following chart types:
- Correlation Matrix
- Geomap
- Hybrids
- Parallel Coordinates
- Ridgeline
- Sunburst
- Treemap