Reshape
Reshape massages your data in to "wide" or "long" forms. In "wide" form, you specify one or more columns to act as unique identifiers for a row. You then create new columns using the values of the other columns you specify. Each row then represents a unique combination of values.
Reshape is similar to Pivot but does not perform any calculations or aggregations on the values in the dataset.
The two forms are defined as follows:
- Long form. Different rows in the dataset can share an identifier, values have their own columns, and each row is distinguished from another row by a combination of the values in each of the row's columns. This is the standard form for many datasets.
- Wide form. Each row has a unique identifier that's made up by the values of one or more columns. Values are distinguished by the name of the column. This often appears as a condensed and deduplicated dataset when compared to the long form.
In "long" form, you also specify one or more columns to act as unique identifiers for a row. You then specify other columns to use as the values of a new "Variables" column. Finally, a new "Values" column is created so that each row represents a unique combination of values for the identifiers, the value of the Variable column, and the value in the Values column.
Format
Reshape uses the following formats:
Reshape the (current dataset | dataset <dataset>) to wide form, creating row IDs for each <columns>, and creating new columns for each <columns>Reshape the (current dataset | dataset <dataset>) to long form, creating row IDs for each <columns>, and creating a Values column from <columns> (except <exception columns>) (and rename the resulting Values column to <new name>, and variables column to <new name>)
Parameters
Reshape uses the following parameters:
dataset(required). The name of the dataset to reshape.columns(required). A comma-separated list of columns to use as either the row IDs or the value column. When reshaping to the long form, you can also specifythe remaining columnsto use the rest of the columns in the dataset in the Values column.exception columns(optional). When reshaping to the long form, if you chose to use the remaining columns in the Values column, you can specify which of those columns to exclude.new name(optional). You can give a new name to the Values and Variables columns.
Output
If the data is successfully reshaped, the new dataset appears in the Data tab.
Examples
Reshaping to Wide Form
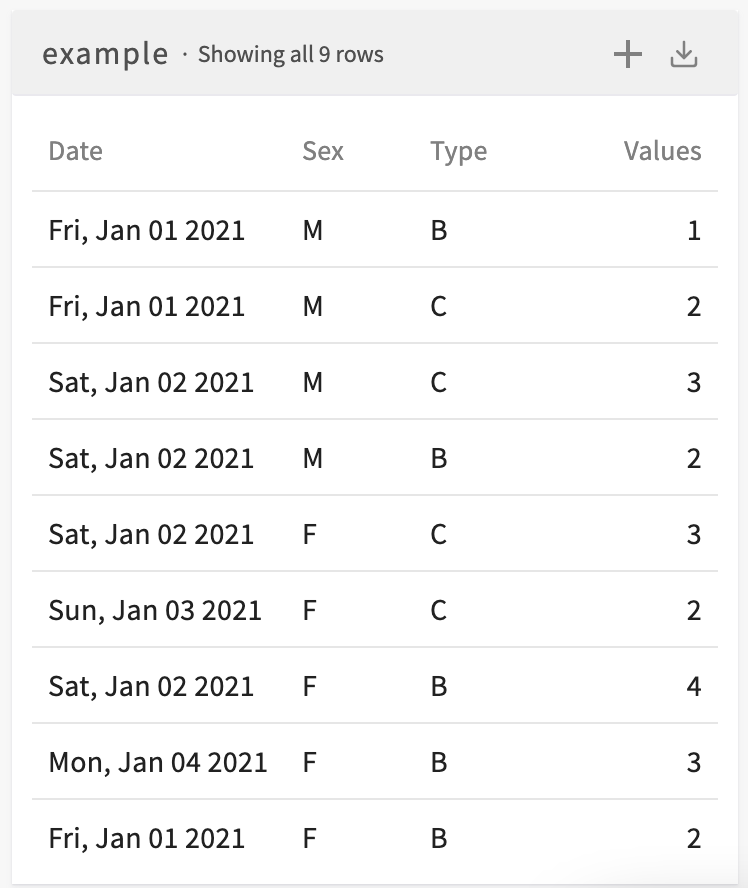
Consider the following dataset:
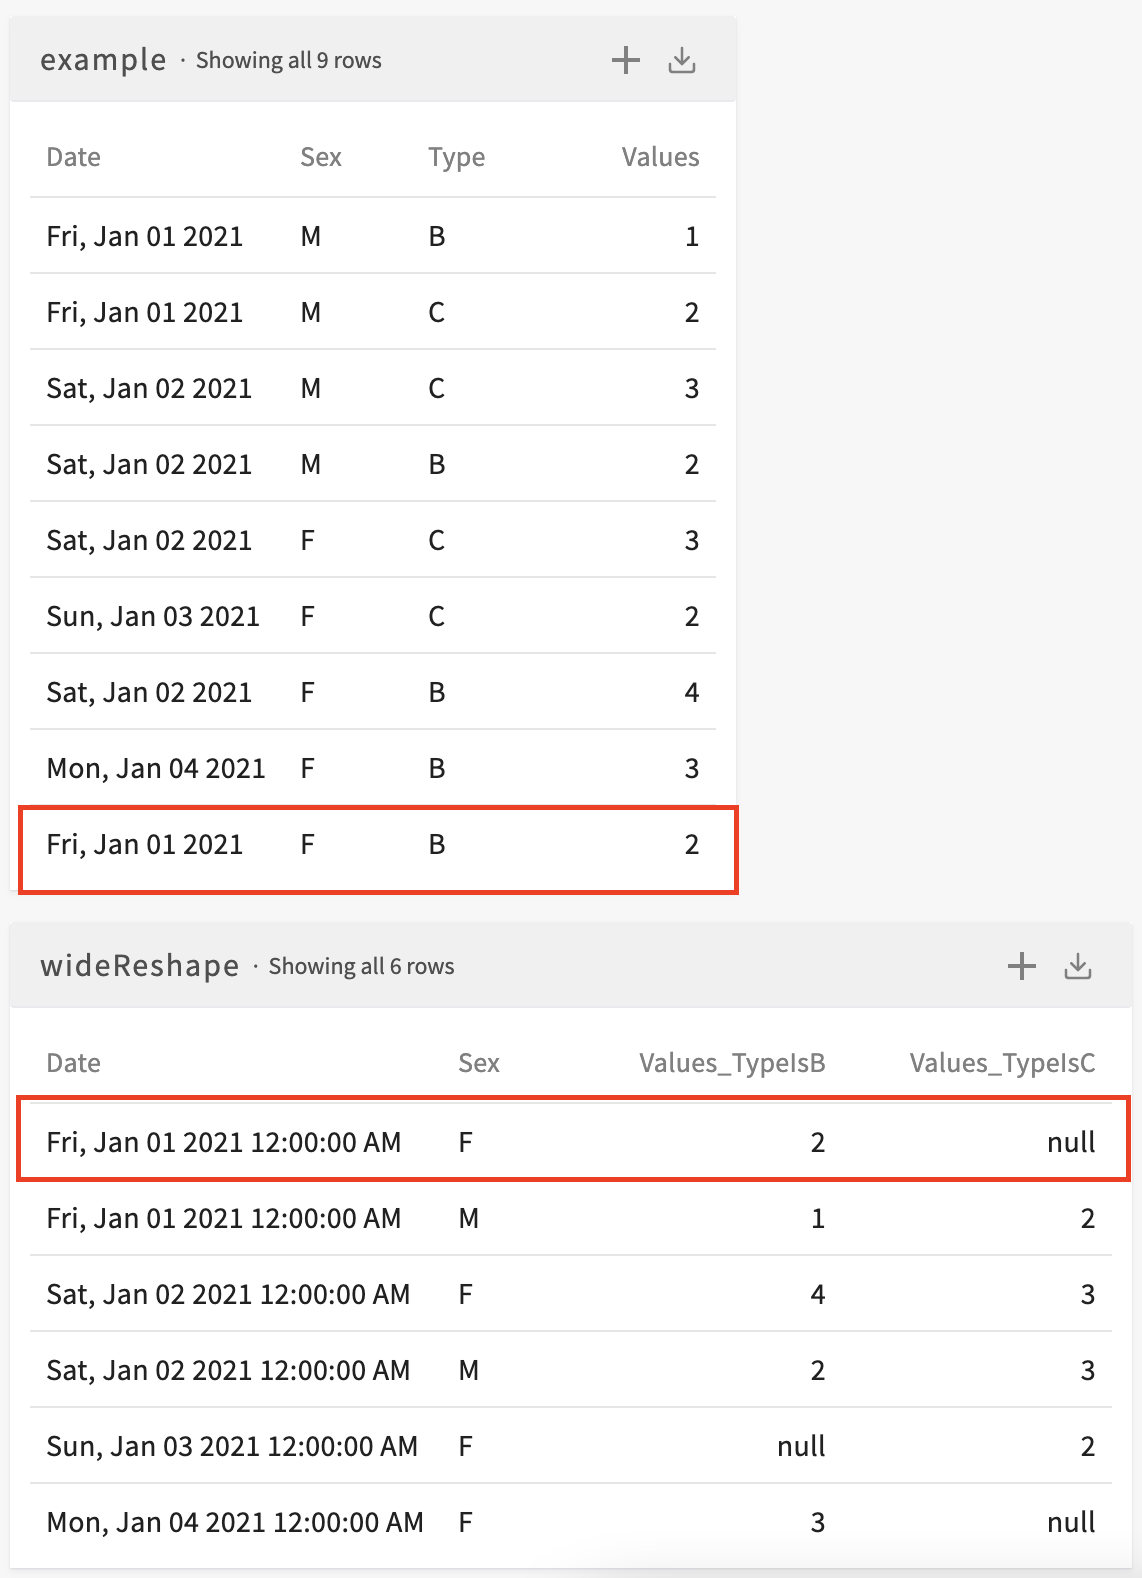
To reshape this dataset to wide form, where the values of the Date and Sex columns identify a row and new columns are created for each value of the Type column, enter Reshape the current dataset to wide form, creating row IDs for each Date, Sex, and creating new columns for each Type. The resulting dataset looks like this:
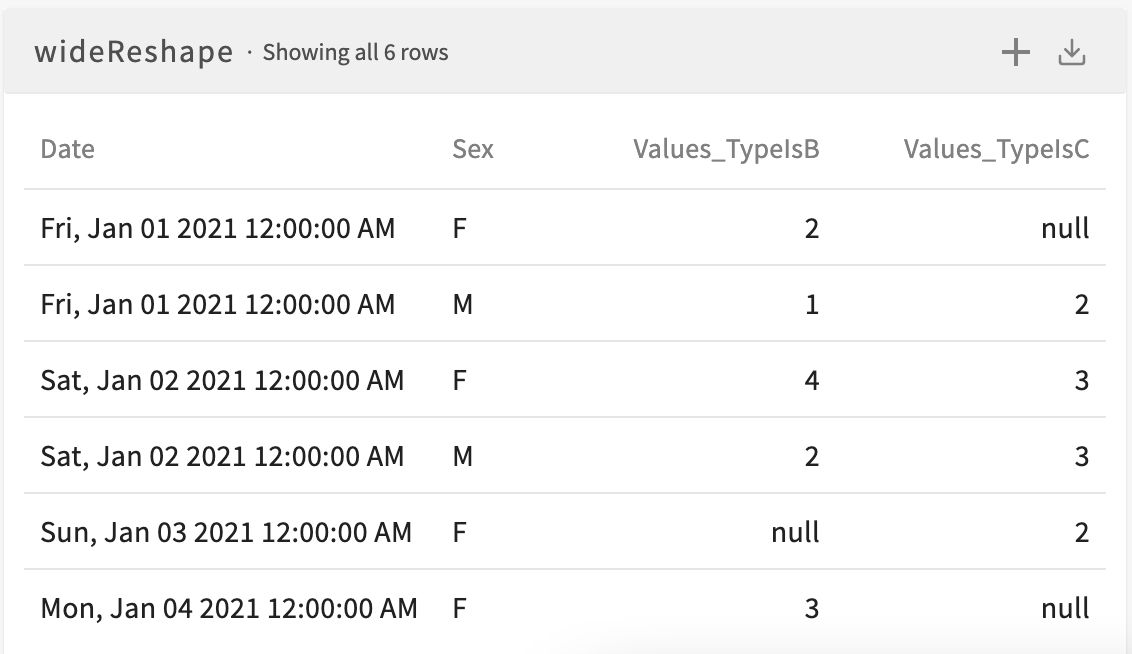
Notice how we now have one row for every unique combination of Date and Sex values and that two new columns have been created for the two unique values in the original Type column. By cross-referencing the two datasets, we see that the values of the new columns correspond to the values in the original Values column for each value of Type:
Reshaping to Long Form
Consider the following dataset:
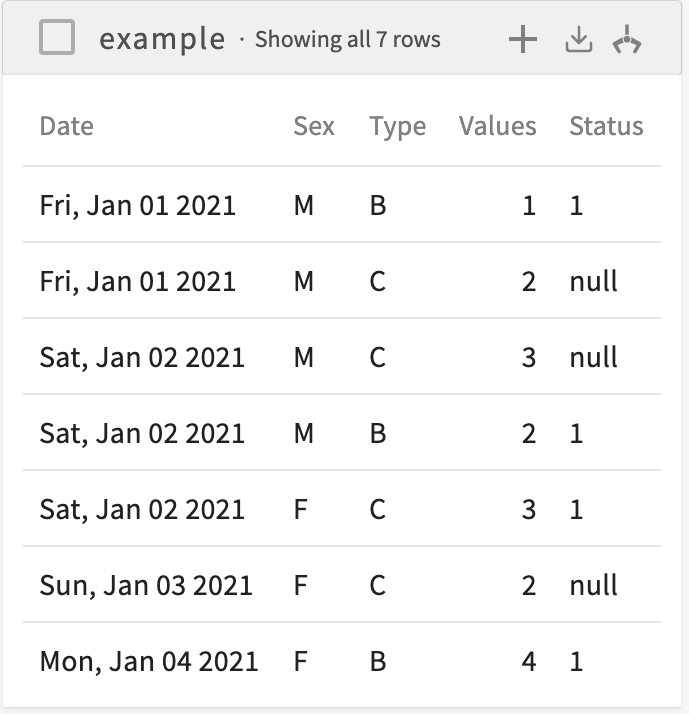
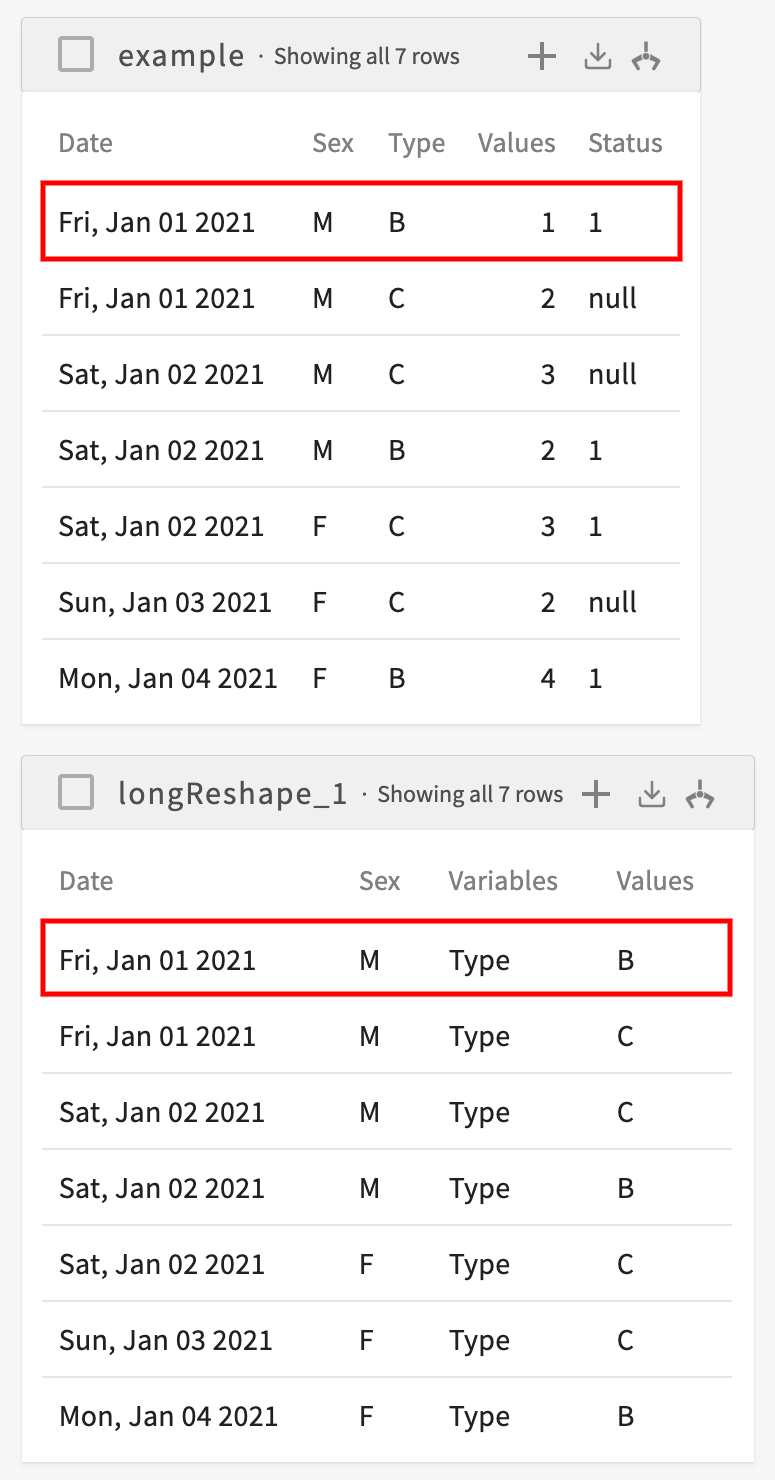
To reshape this dataset to long form, where the values of the Date and Sex columns uniquely identify a row and a row is created for each value of the Type column, enter Reshape the current dataset to long form, creating row IDs for each Date, Sex, and creating a Values column from Type. The resulting dataset looks like this:
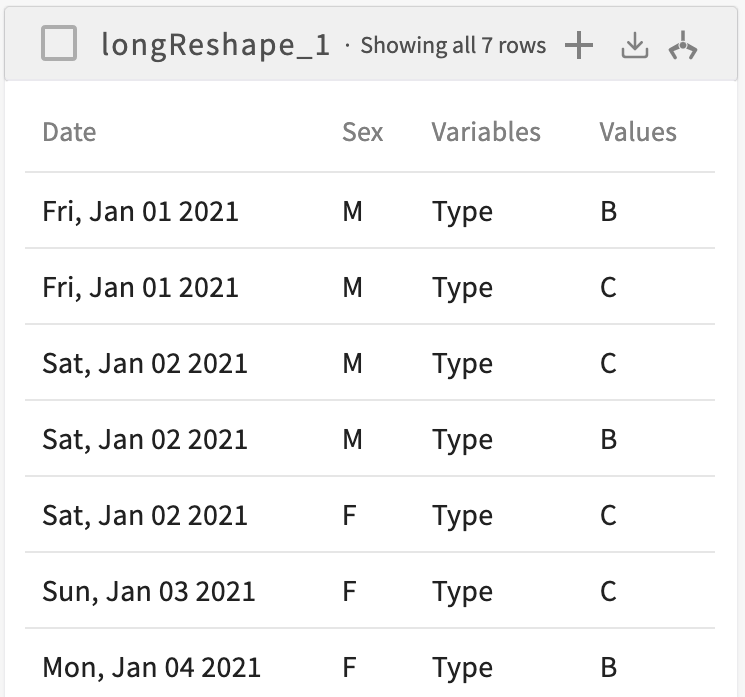
Notice how we now have one row for every unique combination of Date, Sex, and Types values and two new columns: Variables and Values. The Variables column lists the name of the column we specified above as the value column, and the values of that column are used to populate the new Values column. By cross-referencing the two datasets, we see that we now have a row for each unique combination of Date, Sex, and Type: