Predict
The Predict skill has been deprecated in favor of the Train skill and will be removed in a future version.
Predict lets you run a machine learning model you've already trained on a dataset.
Predict time series predicts future values based on a time series column, such as dates.
Format
Predict has several formats:
-
Predict using the model <model> on the dataset <dataset> (considering the test split)
Theconsidering the test splitoption can only be used if a test split was used to train the specified model. -
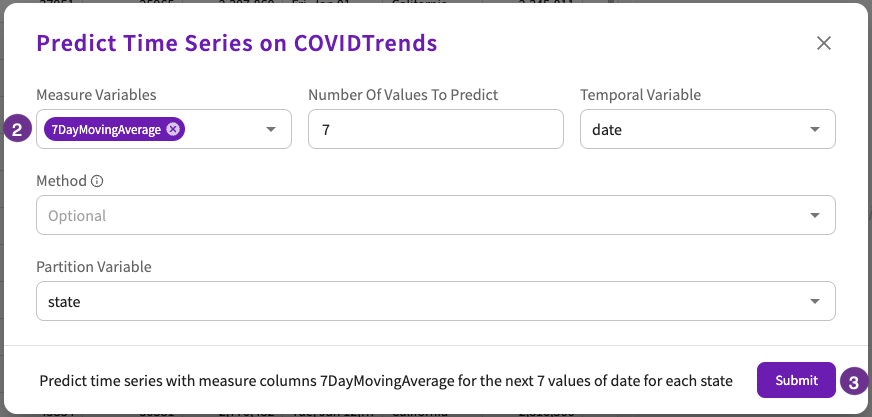
Predict time series on the dataset <dataset> with measure-columns <measure columns> for the next <number> values of <index column> (using method <prediction method>) (filling the missing values using <fill method>) (for each <grouping columns>) (limiting predictions to the range <lower bound> and <upper bound>) (and do not use smart date interpretation) | (setting test holdout percentage as <percentage>)
Creates a forecast for each of the given measure columns in a univariate fashion. -
Predict time series on the dataset <dataset> with measure-columns <measure columns> for the next <number> values of <index column> (using the columns <variable columns>) (for each <grouping columns>) (excluding the columns <exclude variable columns>) (filling the missing values using <fill method>) (and do not use smart date interpretation) | (setting test holdout percentage as <percentage>)
Creates a forecast in a multivariate fashion – with the option of using other time-dependent variables to predict for each of the given measure columns. To include columns for multivariate analysis, use the optionalexcluding the columnsorusing the columns.
Predict using the model <model> on the dataset <dataset> (and display prediction probabilities)
Parameters
Predict uses the following parameters:
dataset(required). The dataset to predict on.model(required). The model to predict with.
Predict time series uses the following parameters:
-
index column(required). The column to use as the index. -
measure columns(required). A comma-separated list of a maximum of two columns whose values to predict. -
number(required). The number of values to predict. -
dataset(optional). The dataset on which to predict the time series. By default, the current dataset is used. -
fill method(optional). The method to use to fill in any missing values. By default, the linear method is used. The options include:- Linear.
- Polynomial with order.
- Spline with order.
-
grouping columns(optional). The columns whose values to use to group the predicted values. -
lower bound(optional). The bottom range of predictions to limit the skill to. If this parameter is set, you must also set the<upper bound>parameter. -
percentage(optional). The percentage, 5% or 10%, to set the test holdout to. -
prediction method(optional). The prediction method to use when predicting a time series. If no option is specified, DataChat automatically determines which method to use. The options include:- ARIMA (univariate, multivariate)
- Prophet (univariate)
- Theta (univariate)
- VAR (univariate, multivariate)
-
upper bound(optional). The upper range of predictions to limit the skill to. If this parameter is set, you must also set the<lower bound>parameter. -
variable columns(optional). The columns to include or exclude for multivariate prediction.
Output
Predicting with a Model
If the prediction is successful, a success message appears in the conversation history and a new expanded dataset appears in the Data tab. The new dataset is the original dataset appended with a new column containing the predicted values for each row.
Otherwise, an error message appears.
Predicting a Time Series
If the prediction is successful:
- A chart containing your predicted values appears.
- A success message appears in the conversation history.
- A new expanded dataset appears in the Data tab.
If you specified upper and lower bounds, and the Prophet prediction method was used, the number of predictions shown might be truncated to respect your bounds.
The new dataset is the original dataset appended with:
- Rows of the predicted future values of the specified column.
- A "Trend" column that indicates whether the values of that row are trending upwards, downwards, or are staying flat.
- A "Method" column (if no method was specified) that indicates what method was used.
- A "UpperBound" and a "LowerBound" column (if upper and lower bounds were used) that indicate the upper and lower bounds of the confidence interval for that row.
- A "Confidence" column (if the Prophet method was selected or chosen) that indicates the confidence (as a percentage) in the predicted value.
- A "truncated" column (if upper and lower bounds, along with the Prophet method, were used) that shows the predicted values in their truncated form.
Otherwise, an error message appears.
Examples
To use a model called "SalesModel" to predict your sales volume for the next quarter using last quarter's data, enter Predict using the model SalesModel on the dataset Q2Sales.
To predict the next 10 values of a column called "CustomersIn" using the column "HourOfDay" as the index for version 5 of the "Sales" dataset, enter Predict time series on the dataset Sales, version 5 with measure-column CustomersIn for the next 10 HourOfDay.
To predict the increase in positive COVID-19 cases in the next five days for each state, enter Predict time series with measure-column positiveIncrease for the next 5 date partition on state.
If the Prophet prediction method is used, the LowerBound and UpperBound columns are added and contain the upper and lower bound of the confidence interval, which is the range the predicted values could land in, or null if the values already exist in the dataset or have been interpolated. The confidence interval is set to 80 percent, meaning that there is an 80 percent chance that the predicted value falls within the interval.
In the resulting chart, the confidence interval is shown as the shaded region around the predicted values: