Natural Resources
In this section, we'll look into the water quality and element levels of the Pivdennyi Buh River using a River Water Quality and Forecasting dataset.
Question
Monitoring water systems is a crucial part of ensuring that lakes, rivers, and reservoirs are clean and healthy enough to support and maintain regional ecosystems. Can we predict the ammonium, oxygen, nitrate, nitrogen dioxide, sulfate, phosphate, and chlorine levels of the Pivdennyi Buh River for the next 6 months?
Challenges
There are several challenges that can make analyzing this data complex:
- Technical barriers. Advanced data analytics tools, such as machine learning models and data visualizations may be needed to effectively analyze large amounts of data.
- Interpretations and results. Multiple contextual factors may influence element levels present in the river, such as weather conditions, season, and human impacts (littering, pollution, and man-made disasters).
- Bias and error. Interpretation of results can be influenced by individual experience and perspectives.
Method
Load Data
Let's get an idea of the data we're working with. Upload the River Water Quality and Forecasting dataset into your session. Note that this downloads as a .zip folder. Extract the contents of the .zip folder to upload the "PB_All_2000_2021" .csv file into DataChat.
Our resulting dataset should look something like this:
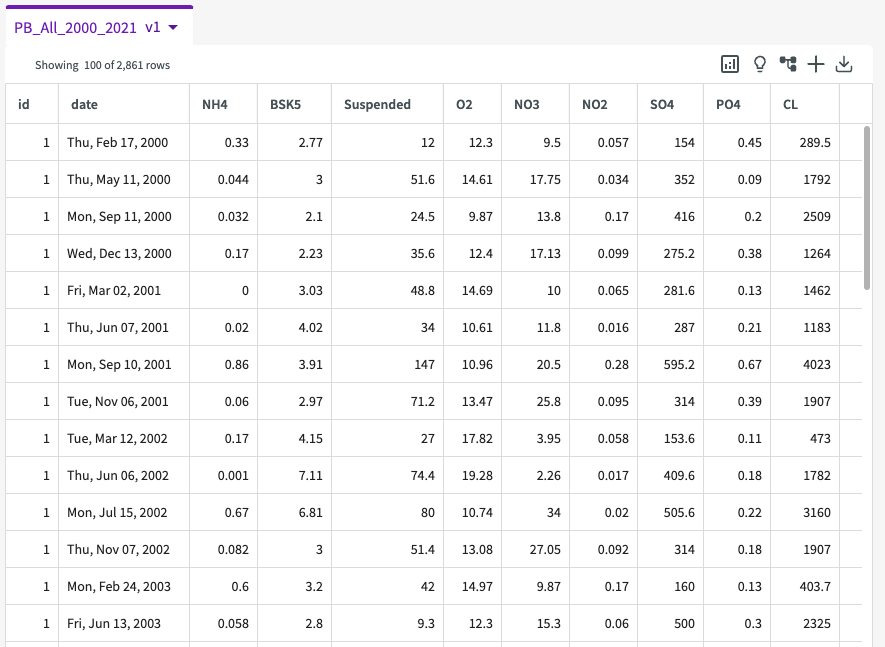
We can see that this dataset contains the following columns:
- id. The ID of the water station. There are 22 stations along the river, station 1 is at the beginning of the river and station 22 is at the end.
- date. The date which the values were recorded.
- NH4. Ammonium levels.
- BSK5. Biochemical Oxygen Demand per 5 days.
- Suspended. Suspended substances.
- O2. Oxygen levels.
- NO3. Nitrate levels.
- NO2. Nitrogen Dioxide levels.
- SO4. Sulfate levels.
- PO4. Phosphate levels.
- CL. Chlorine levels.
Extract and Bin Data
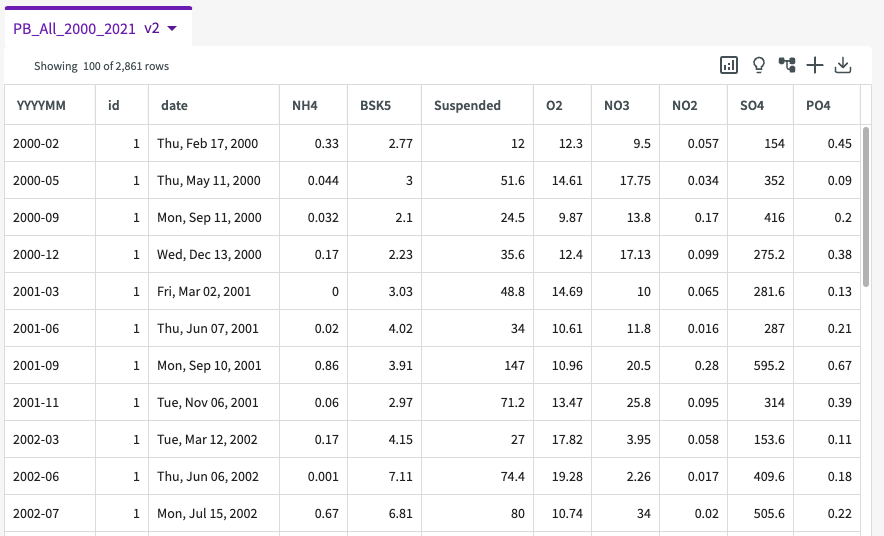
Looking at our data, we can see that the "date" column includes the weekday, month, day, and year for each record over the past 21 years. Let's extract the month and year from each date to better organize the time from which the data was collected. Click Add Column > Extract in the skill menu, enter "date" for the column, "YYYYMM" for the date parts to extract, and "YYYYMM" for the extracted column name.
Our dataset now contains a "YYYYMM" column that specifies the month and year for each record:
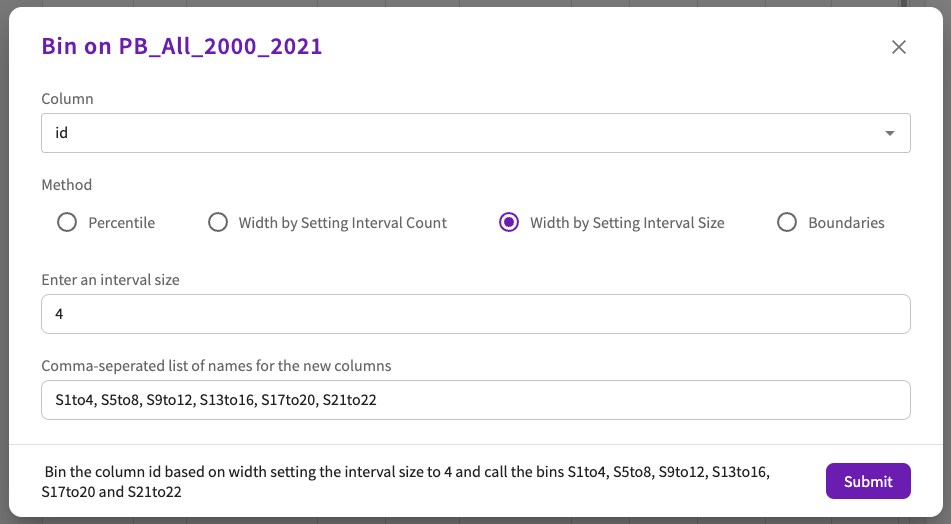
Let's also create 6 bins for the water stations along the river. This will help us to group large amounts of small data into bigger bins which will make forecasting this data much easier. Click Add Column > Bin in the skill menu, then:
- Select "id" for the Column.
- Select "Width by Setting Interval Size" for the Method.
- Enter "4" for the interval size.
- Enter "S1-4, S5-8, S9-12, S13-16, S17-20, and S21-22" for the new column names.
- Click Submit.
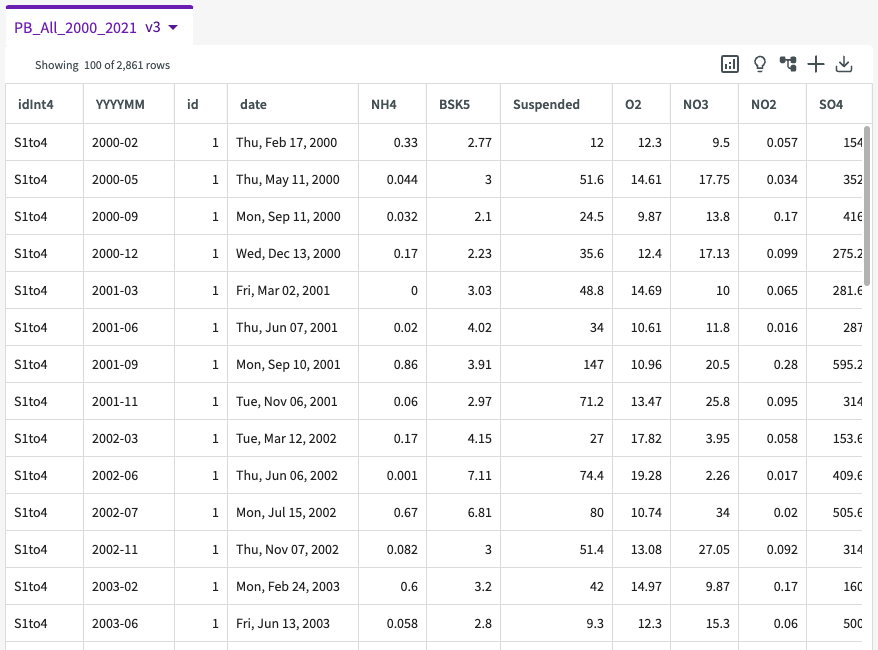
Our dataset now contains a "idInt4" column that specifies the station group for each record:
Train Time Series
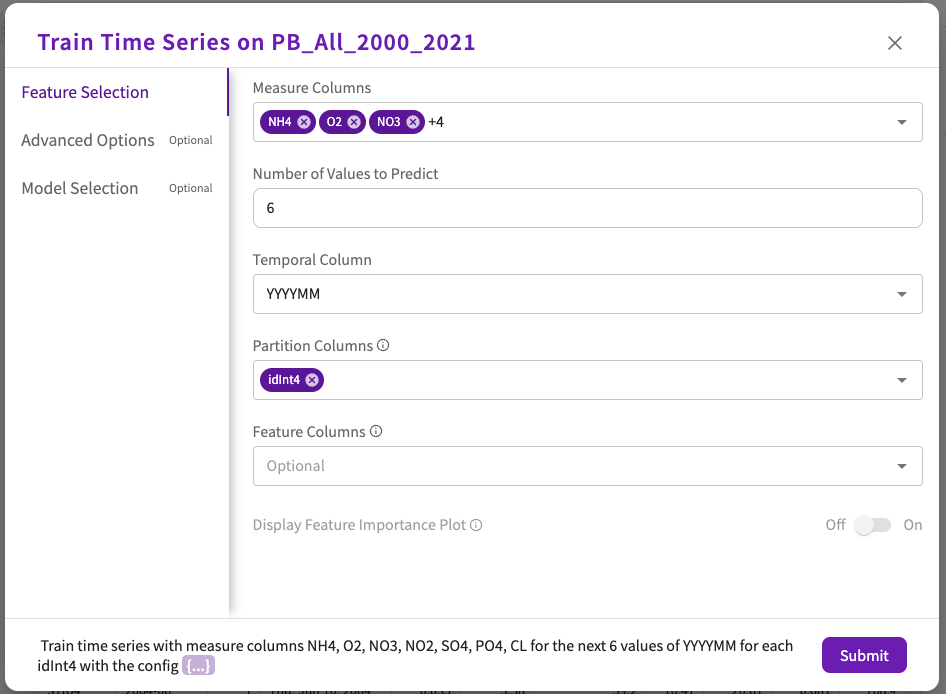
From here, let's train a time series model to predict the element levels for the next 6 months. Click Machine Learning > Train Time Series in the skill menu, then:
- Select "NH4", "O2", "NO3", "NO2", "SO4", "PO4", and "CL" for the Measure Columns.
- Enter "6" for the number of values to predict.
- Select "YYYYMM" for the Temporal Column.
- Select "idInt4" for the Partition Column.
- Click Submit.
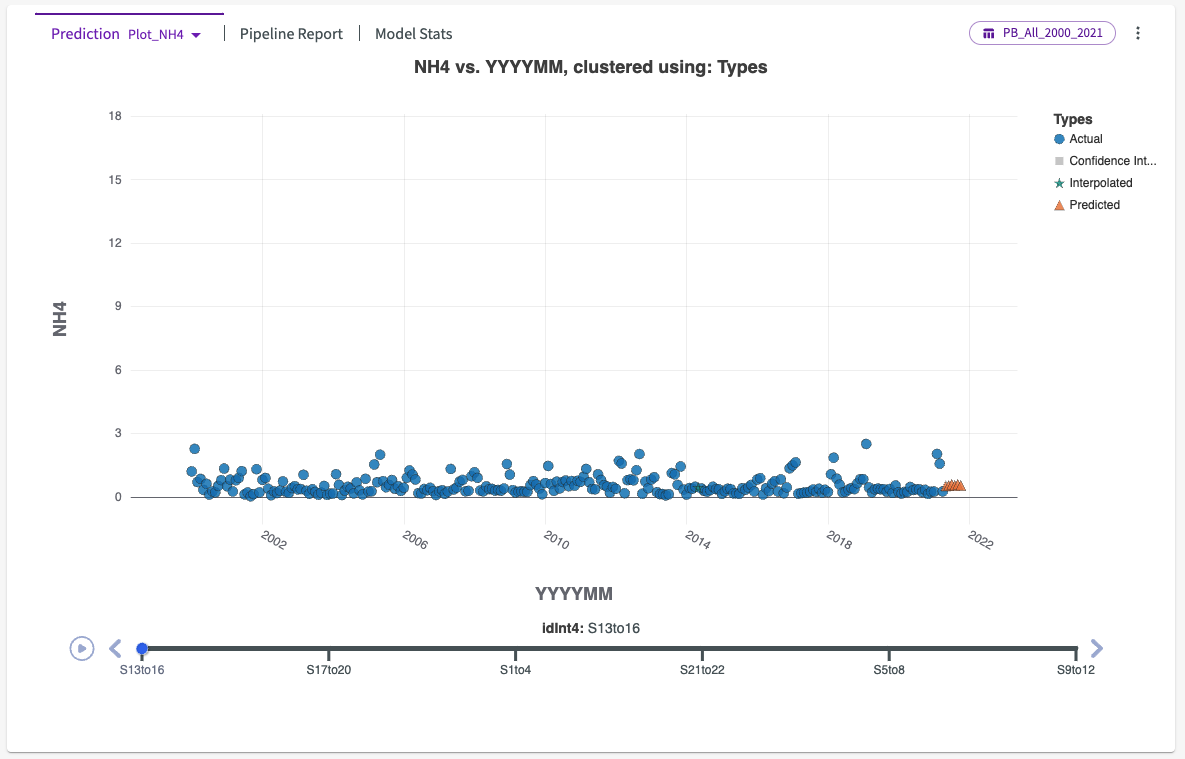
The Train Time Series output gives us an expansive look into the predictions for each element for each section of river:
We can use the slider and prediction plot dropdown to switch between each elements predicted values:
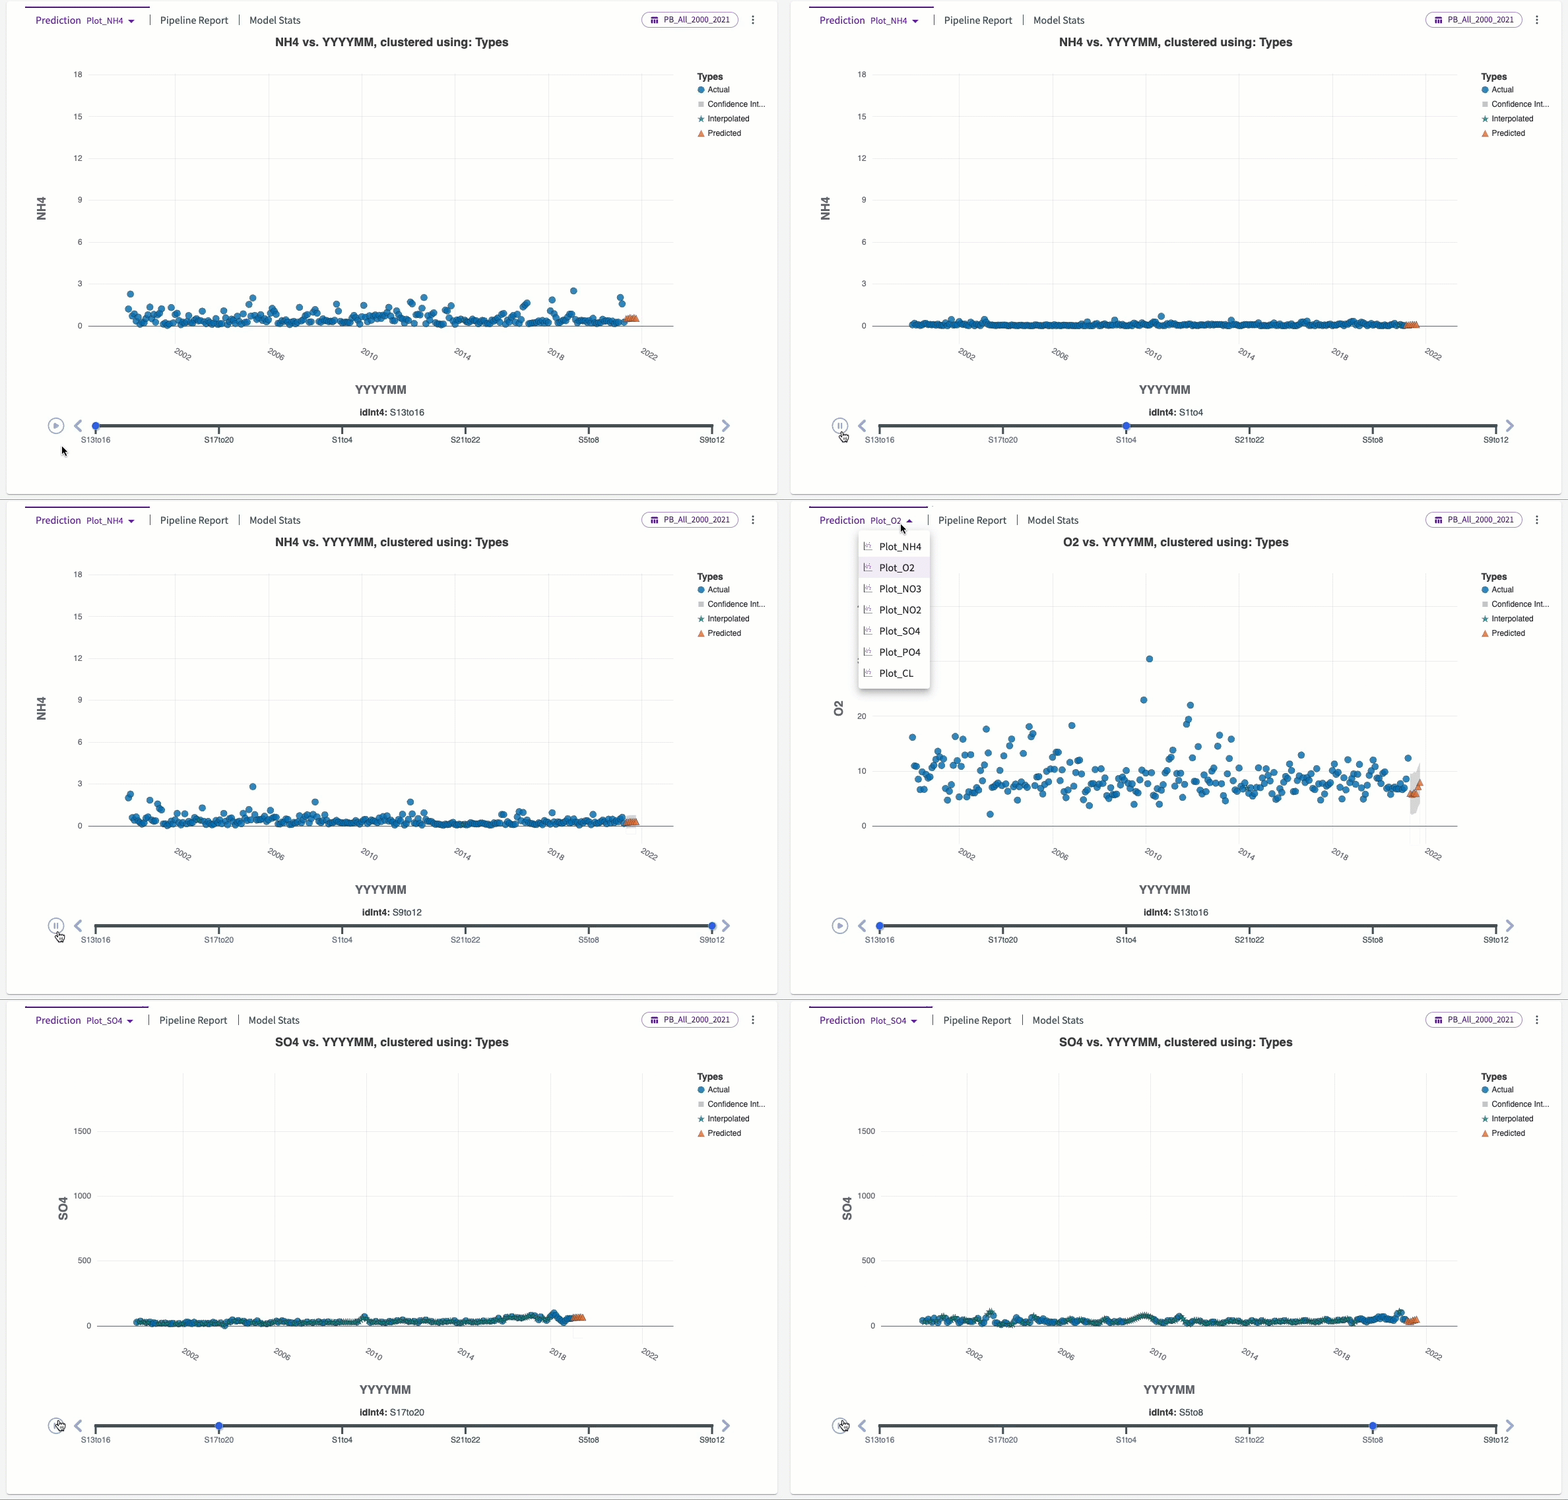
From the output, we can see the predicted element levels for the next six months. Here's an example table of predicted values we see for stations 17-20.
| Element | Month 1 level | Month 2 level | Month 3 level | Month 4 level | Month 5 level | Month 6 level |
|---|---|---|---|---|---|---|
| CL | 40.52 | 33.28 | 40.73 | 32.54 | 42.27 | 45.66 |
| NH4 | 40.52 | 1.55 | 0.72 | 0.82 | 1.22 | 1.11 |
| NO2 | 0.58 | 0.29 | 0.18 | 0.33 | 0.39 | 0.30 |
| NO3 | 0.28 | 1.65 | 0.72 | 2.36 | 2.40 | 2.37 |
| 02 | 2.78 | 5.48 | 5.40 | 5.68 | 6.77 | 8.31 |
| PO4 | 0.31 | 0.31 | 0.31 | 0.32 | 0.32 | 0.32 |
| SO4 | 34.72 | 35.05 | 33.54 | 33.38 | 33.14 | 33.09 |
For more information see our Train Time Series documentation.
Results
Through our analysis, we have been able to predict element levels in the Pivdennyi Buh River for the next six months. Some of the key findings include:
- Across all station groups, Oxygen follows a consistent pattern of increasing and decreasing values about every six months.
- Phosphate level volatility has increased since 2015.
- Ammonium levels increase between stations 17-20 compared to all other parts of the river.
- Chlorine levels are more sporadic at the beginning of the river.
Agencies that monitor and maintain this river can use these findings to make informed decisions on subjects such as:
- Fish populations.
- Pollution restrictions.
- Channel modifications.
- Sediment levels.
- Chemical treatments.