Finance
In this section, we'll investigate New York Stock Exchange data from 2013 to 2018 using a S&P 500 Stock Dataset.
Question
Stock monitoring and analysis is a crucial element for brokers and investors to determine value and risk associated with the current markets. With an exceptionally volatile market that changes frequently, being able to monitor trends in the market values can give investors a more competitive edge. Can we compare the average high and low values between 2016 and 2018 for Zoetis Inc. ($ZTS) and determine which quarters in these years have the most trade volume?
Challenges
The stock exchange is a highly regulated and documented area of economics across the globe. However, despite the availability of this data, several challenges can make analyzing this data complex:
- Volatility. The market is subject to change quickly due to socio-political factors.
- Technical barriers. Advanced data analytics tools, such as machine learning models and data visualizations may be needed to effectively analyze large amounts of data.
- Bias and error. Interpretation of results can be influenced by individual experience and perspectives.
Method
With DataChat, we can quickly and confidently address these challenges to find meaningful insights in our exchange data.
Load Data
Let's get an idea of the data we're working with. Upload the S&P 500 Stock Dataset into your session. Note that this downloads as a .zip folder from Kaggle. Extract the contents of the .zip folder and upload the all_stocks_5yr.csv file into DataChat.
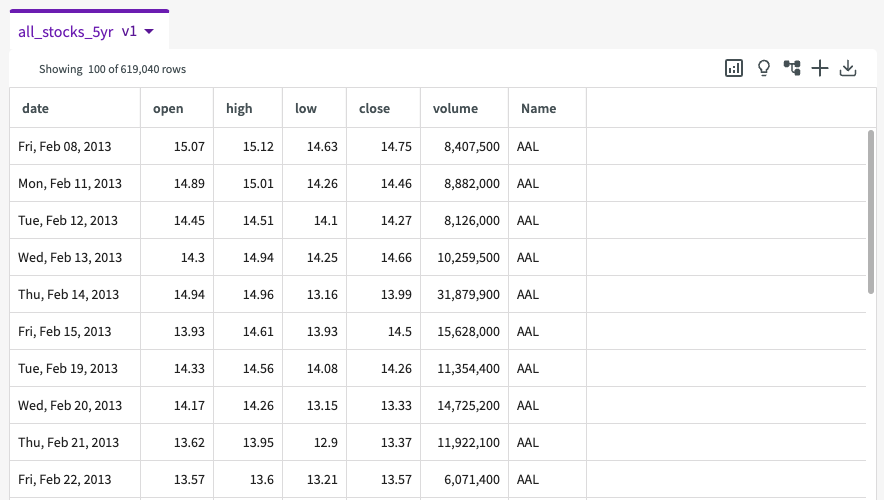
This dataset contains the following columns:
- date. The date of stock record.
- open. The opening value (USD).
- high. The highest value (USD)
- low. The lowest value (USD).
- close. The closing value (USD).
- volume. The amount of stocks traded.
- Name. The name of the stock.
Investigate Data
Let's investigate our data a bit. We can click Show Descriptive Statistics in the dataset header to provide summary statistics, such as unique values, minimum and maximum values, and null values.

From these statistics we can see that there are seven total columns, each providing additional context to the type of data we're working with. We can see that there are 505 unique stocks in this dataset, dated from February 2013 to February 2018.
More importantly, we can also see that every one of these columns has less than 1% of null values, meaning that our data is of good quality and will need minimal cleaning.
Wrangle Data
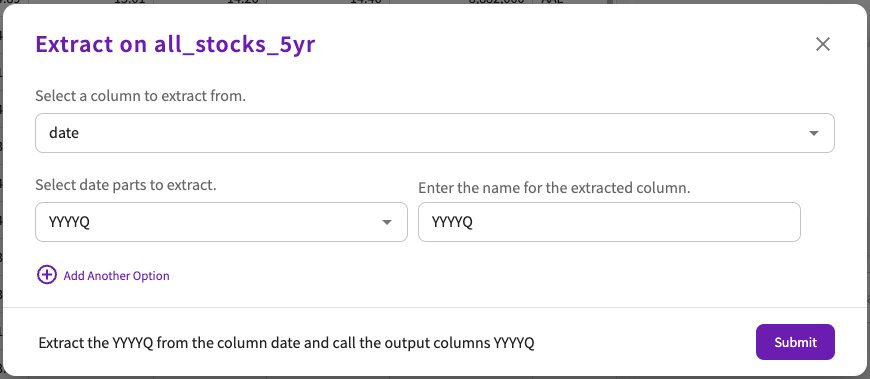
Before we create a comparison, let's quickly prepare our data by extracting the year and quarter from the "Date" column. Click Add Column > Extract. Enter "Date" for the column to extract from, "YYYYQ" for the date parts to extract, and "YYYYQ" for the new column name:
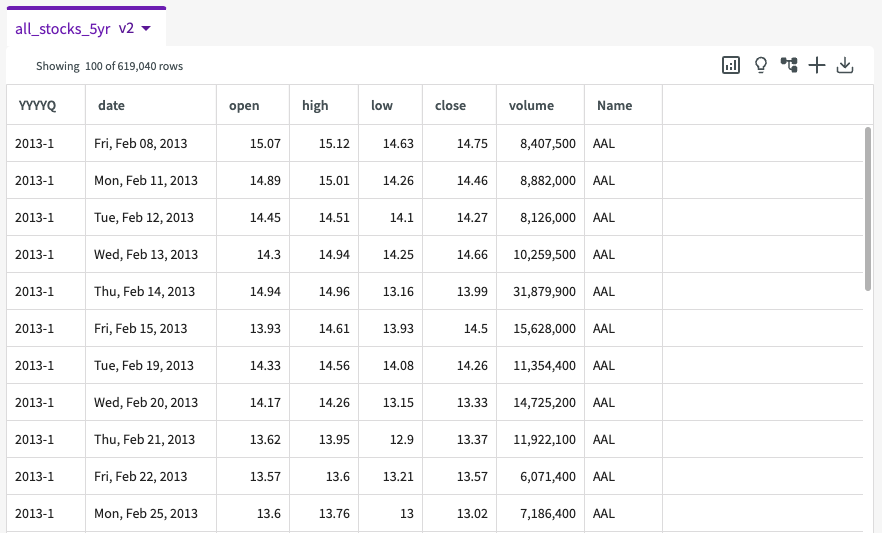
We're then given a second version of this dataset with a new "YYYYQ" column:
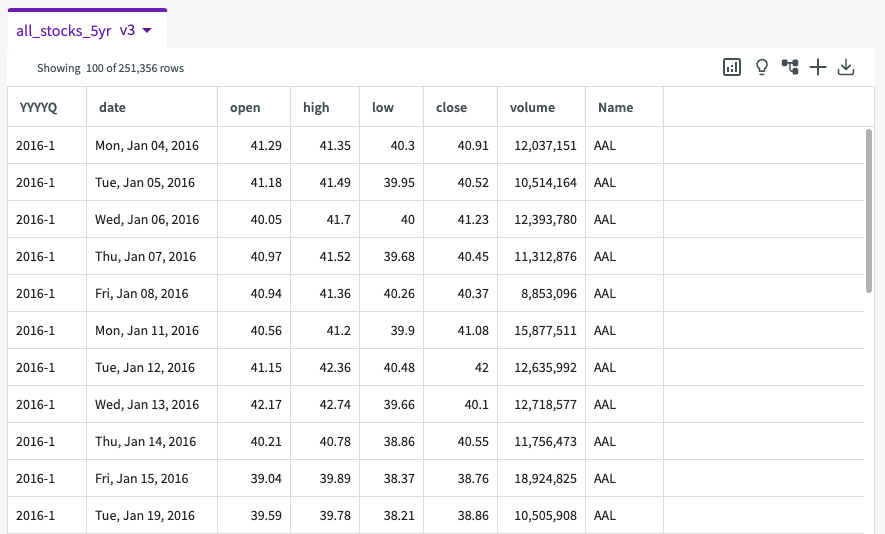
From here, let's also only keep the rows that include data for the years we're investigating, 2016 and 2017. Click Wrangle > Keep Rows and select "Date" for the Column, "is between the dates" for the Expression, and "01-01-2016" and "12-31-2017" for the Date Range. Our resulting dataset now looks like this:
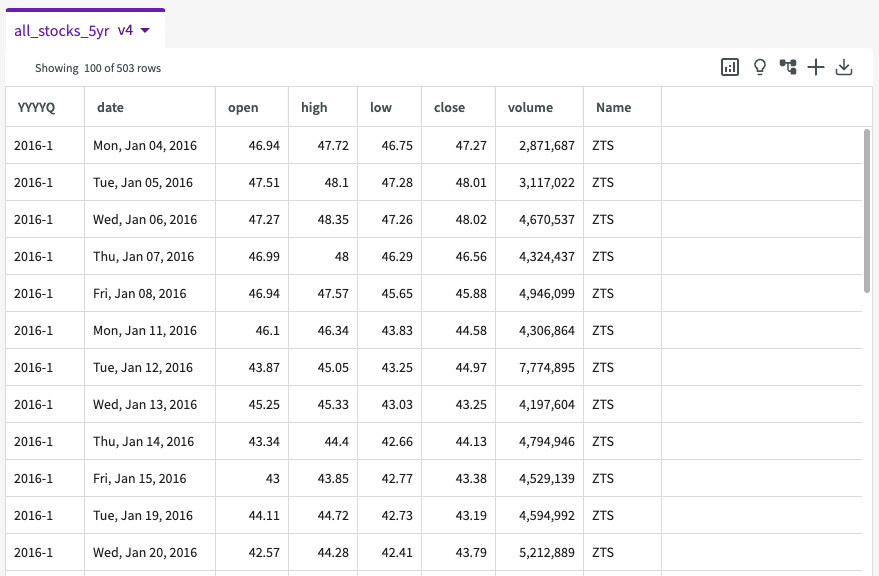
Let's use Keep once more to only view the ZTS stock data. Click Wrangle > Keep Rows and select "Name" for the Column, "contains" for the Expression, and "ZTS" for the Value. Our resulting dataset now only contains ZTS stock data:
Visualize Data
Now that we've cleaned up our data, we're ready to create a compelling visualization to compare the average high and low values. Click Plot in the skill menu to open the Chart Builder.
In the Chart Builder:
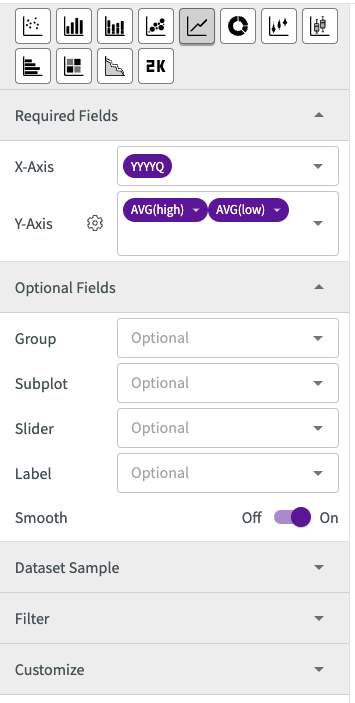
- Select "Line Chart" for chart type
- Under Required Fields, enter "YYYQ" for the X-Axis, "High" and "Low" for the Y-Axis, and "Average" for the Y-Axis Aggregate.
- Under Optional Fields, Toggle Smooth to On.
The resulting chart looks like this:
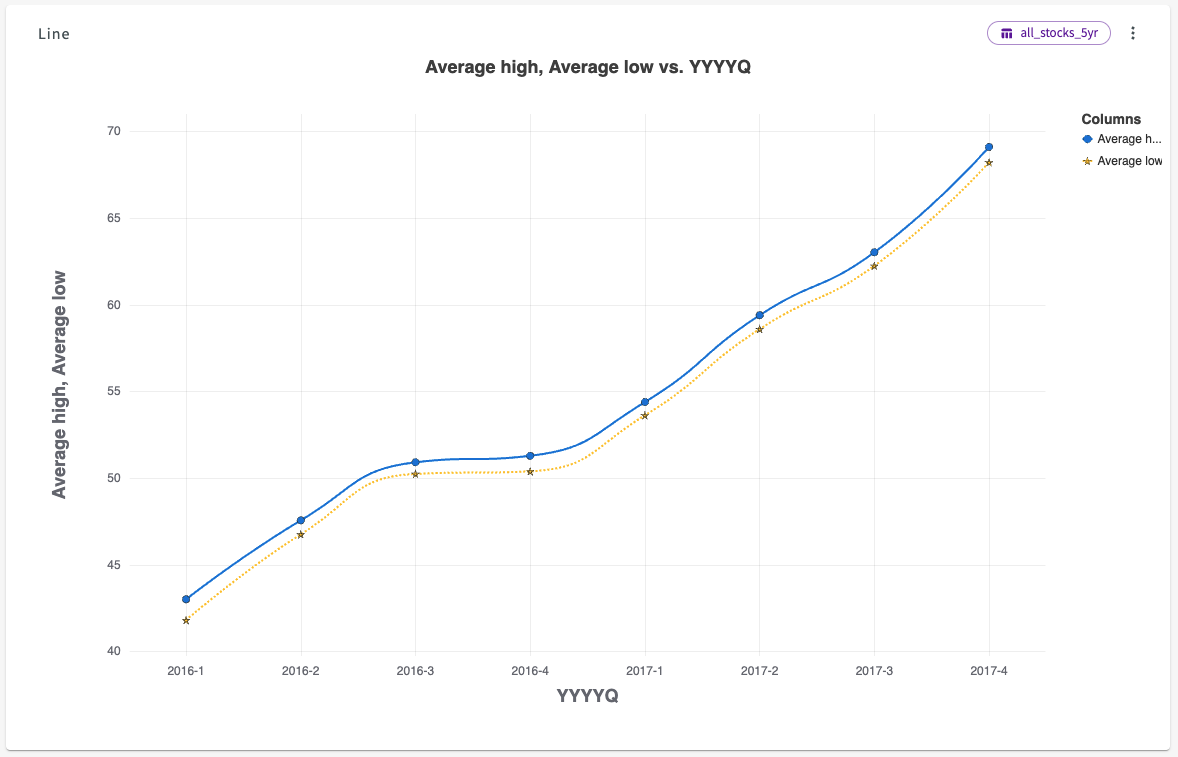
This simple line chart reveals to us that not only does ZTS stock have very steady high and low values, but that these values continued to increase over the two year period by nearly 66%.
Let's plot a second chart to compare volumes between 2016 and 2017. Click New Chart in the top left of the Chart tab to open the Chart Builder, then:
- Select "Violin Chart" for chart type.
- Under Required Fields, enter "YYYYQ" for the X-Axis and "volume" for the Y-Axis.
The resulting chart looks like this:
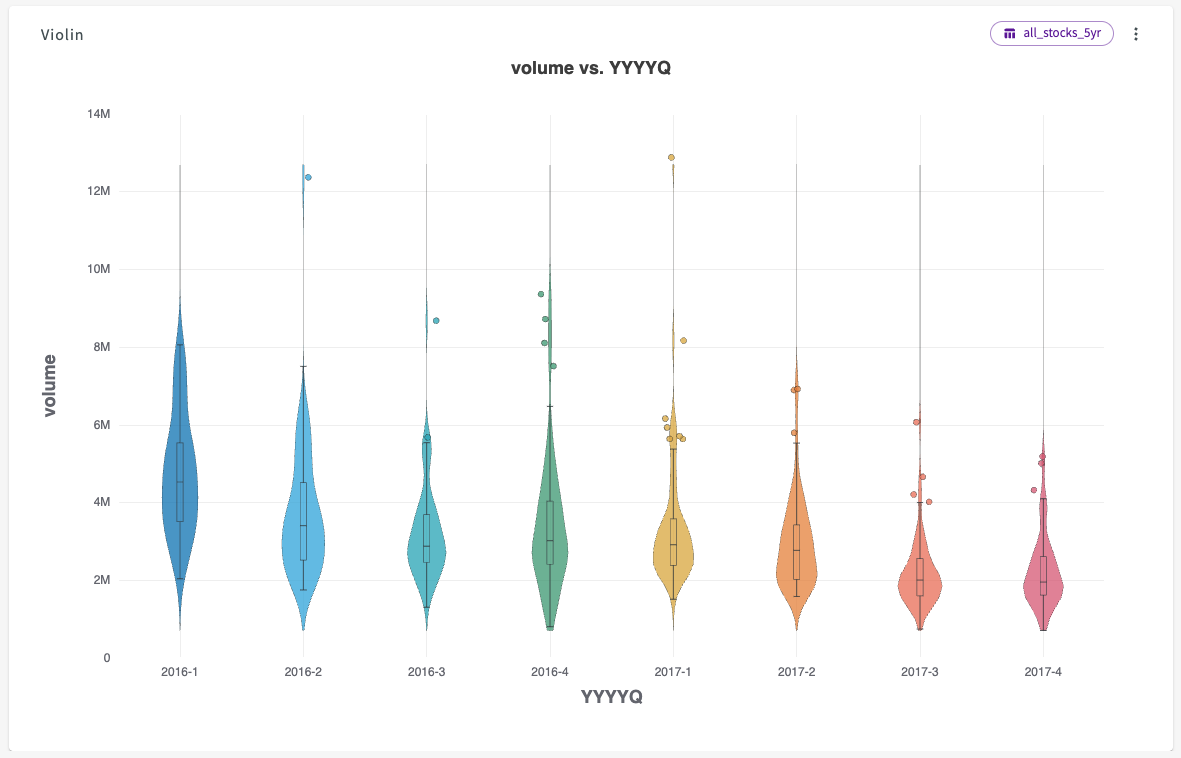
We can see from this violin chart that between 2016 and 2017 the total volume steadily decreased, meaning that trades were happening less.
Results
Through our analysis, we have identified several notable observations of ZTS stock:
- Zoetis Inc. stock high and low values do not typically fluctuate.
- Over 24 months, the stock continued to increase in value.
- Over the same 24 months, the stock volumes steadily decreased.
Based on these findings, we can determine a few key findings and suggestions from this analysis:
- Considering that Zoetis Inc. stocks continue to increase in value and decrease in volume, purchasing and holding ZTS stock is a generally low-risk and reliable investment for stock investors. Although these investors may not see quick and large spikes in value, they can be assured that the volatility of ZTS is exceptionally low.