Healthcare
In this section, we'll investigate health data and its relation to heart disease using a Personal Key Indicators of Heart Disease dataset.
Question
Heart disease is a serious health issue that affects more than 523 million people worldwide. In 2020, approximately 19 million deaths were attributable to some form of heart disease, approximately 32% of all global deaths. Heart disease worldwide has increased by nearly 19% since 2010 and is projected to continue to rise without intervention. Can we predict which factors most impact the likelihood of heart disease?
Challenges
Healthcare is an exceptionally large industry that impacts billions of people worldwide across multiple difference channels. Several challenges can make analyzing this data complex:
- Technical barriers. Advanced data analytics tools, such as machine learning models and data visualizations, might be needed to analyze large amounts of data effectively.
- Data and result interpretation. This dataset provides a large amount of data regarding individual habits and health but lacks a range for those variables. For example, an individual can answer "yes" if they've smoked cigarettes, but the data doesn't detail the amount an individual smokes or for how long.
- Variables. Human health is also impacted by hundreds of internal and external variables, such as socio-economic status, genetic makeup, religious beliefs, and more, that aren't included in this specific dataset.
- Bias and error. Interpretation of results can be influenced by individual experience and perspectives.
Method
Load Data
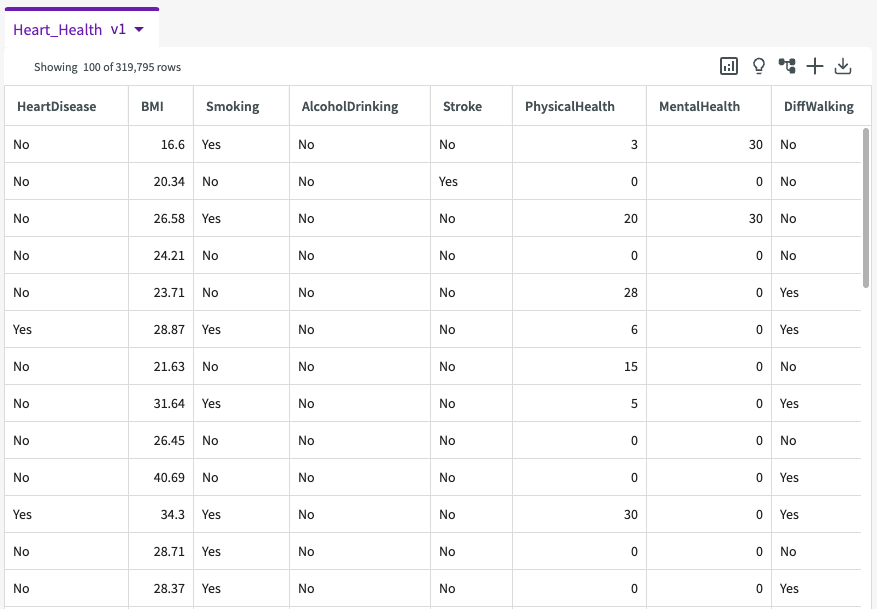
Let's get an idea of the data we're working with. Load the provided demo dataset, "Heart_Health", into your session. The dataset should look something like this:

This dataset includes the following columns:
- HeartDisease. Respondents that have ever reported having coronary heart disease or myocardial infarction.
- BMI. Body Mass Index.
- Smoking. Whether or not the respondents have smoked at least 100 cigarettes during their lifetime.
- AlcoholDrinking. Adult men having more than 14 drinks per week and adult women having more than 7 drinks per week.
- Stroke. If respondents have ever had a recorded stroke.
- PhysicalHealth. How many of the last 30 days were spent being sick or injured.
- MentalHealth. How many of the last 30 days were spent in poor mental health.
- DiffWalking. Difficulty walking or climbing stairs.
- Sex. The sex of the respondent.
- AgeCategory. The age of the respondent from 18-80+, broken down into 14 categories, each a four year span.
- Race. The respondent's race.
- Diabetic. Whether or not the respondent has recorded diabetes.
- PhysicalActivity. Adults who reported doing physical activity or exercise during the past 30 days other than their regular job.
- GenHealth. Respondents self-reported perceived health including excellent, very good, good, fair, and poor.
- SleepTime. How many hours of sleep per 24 hours on average.
- Asthma. If respondents have been diagnosed with asthma.
- KidneyDisease. If respondents have been diagnosed with kidney disease (not including kidney stones, bladder infection or incontinence).
- SkinCancer. If respondents have been diagnosed with skin cancer.
Investigate Data
From here, we can click Show Descriptive Statistics in the dataset header to provide summary statistics about our data, such as column types, counts, values, representation types, and more.

From these statistics, we can see that there are 18 columns with 319,795 rows. We can also see that many of the columns only have 2 unique values which indicates yes/no answers. This may be useful in our interpreting our findings moving forward.
Use Train
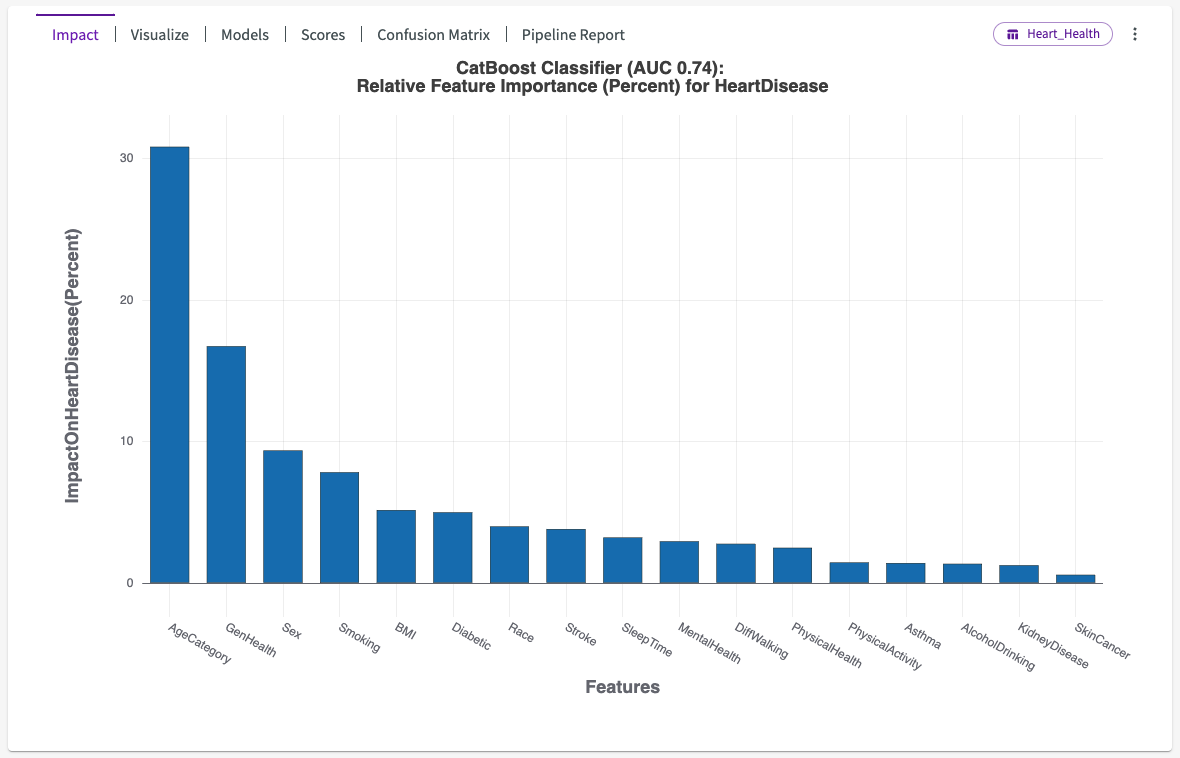
Let's dive into our analysis using Train. Click Machine Learning > Train Model in the skill menu, enter "HeartDisease" for the target column, and click Submit. DataChat then trains and cross-validates several machine learning models. The winning model's impact chart looks something like this:

From this impact chart, we can see that "AgeCategory" followed by "GenHealth", "Sex", and "Smoking" have the most impact on whether or not an individual has heart disease.
Create Visualizations
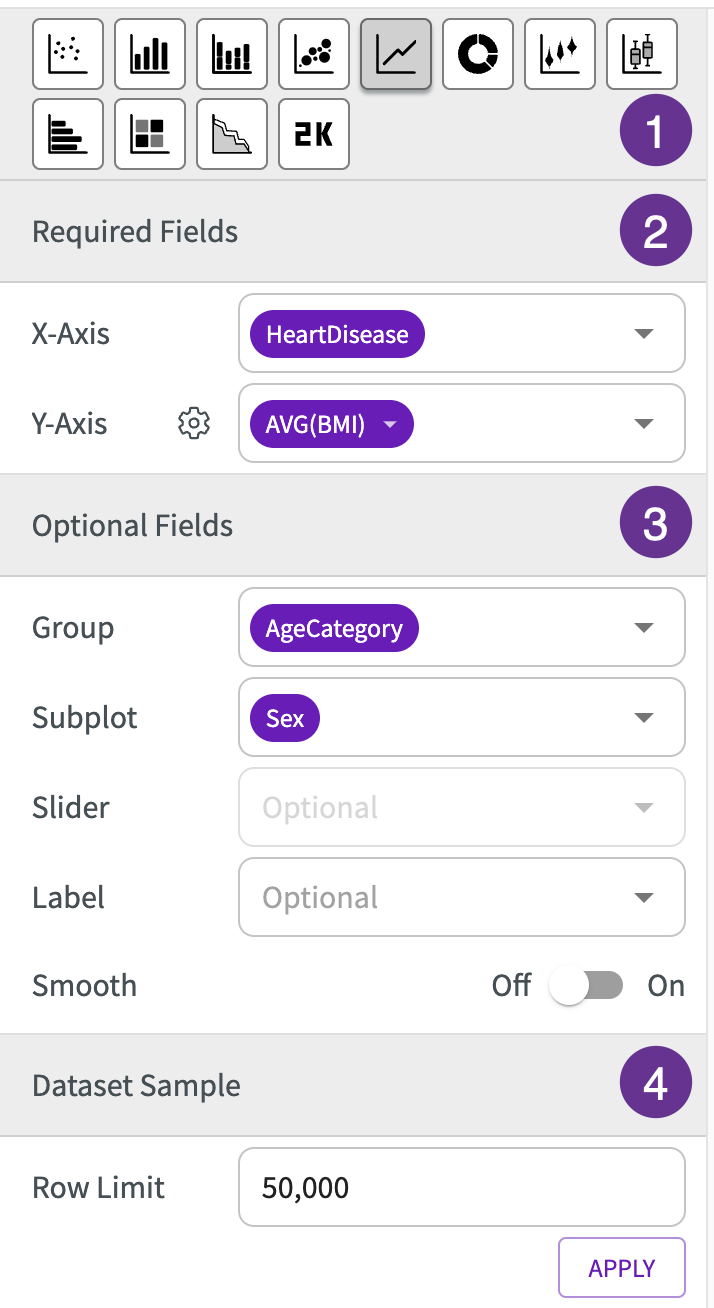
Let's take this a step further by creating a chart to investigate the affect of BMI on heart disease. Click New Chart in the top left of the Chart tab, then:
- Select Line Chart.
- Under Required Fields, enter "HeartDisease" for the X-Axis, "BMI" for the Y-Axis, and "Average" as the Y-Axis Aggregate.
- Under Optional Fields, enter "AgeCategory" for Group and "Sex" for Subplot.
- Set the Dataset Sample limit to 50,000 rows and click Apply.
- Click Submit.

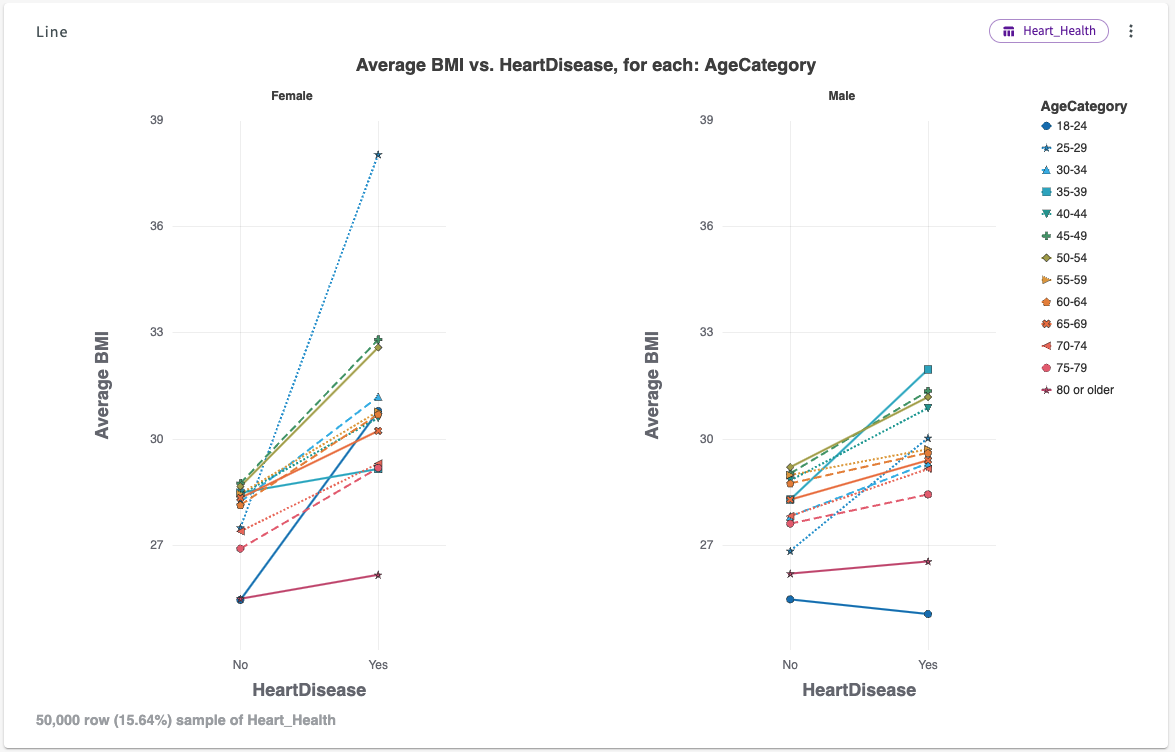
Our resulting chart looks like this:

From this chart, we can confirm again that as age increases, heart disease rates also increase. This chart also reveals the relationship between increased BMI and the likelihood of heart disease, except for the youngest age category for women, and the youngest 3 age categories for men.
Results
Through our analysis, we have identified several factors that most influence whether an individual has an increased risk of heart disease, including:
- Age.
- BMI.
- Sex.
- General health.
- Smoking.
We have observed that regardless of one's current health, age is the most prominent indicator of whether or not an individual is at risk of heart disease. We also observed that there are other factors, such as increased BMI and female sex, that also contribute to an increased risk. The analysis revealed that having skin cancer, daily physical activity, and alcohol consumption are not the primary factors that affect heart disease risk, instead, smoking and having diabetes have indicated a more significant impact.
Based on these findings, we can recommend several actionable steps to that can be taken by healthcare providers and patients:
Healthcare Providers can:
- Provide more heart disease-related resources, such as yearly blood tests or coronary angiograms, to ageing populations to better monitor heart disease risk.
- Focus on educating patients about the risks of heart disease from early adulthood to encourage a healthy lifestyle.
Patients can also:
- Eat a balanced diet with regular activity to encourage a healthy BMI and prevent diabetes.
- Avoid smoking and tobacco use.
- Attend regular check-ups and doctors' office visits, and frequently talk to your doctor about your heart disease risk.