Manufacturing
In this section, we'll investigate manufacturing machine failures using a Machine Predictive Maintenance dataset that includes data on the manufacturing process and machine health.
Question
Manufacturing industry faces significant challenges due to machine failures and operational downtime. Such equipment malfunctions lead to costly repairs, reduced productivity, potential risks to worker safety and health, and delays in order fulfilment. Hence, it becomes imperative for manufacturing enterprises to monitor and assess the key factors that contribute to machine failures.
Challenges
The manufacturing industry produces and collects a lot of data, so datasets are often quite large and hard to work with. There are several other factors to also consider when analyzing large data:
- Technical barriers. Advanced data analytics tools, such as machine learning models and data visualizations may be needed to effectively analyze large amounts of data.
- Data cleanliness. There are thousands of manufacturing factories around the world, each with their own way of recording data.
- Interpretations and results. Multiple external factors may influence machine handling, such as materials, scheduled inspections, and worker use.
- Bias and error. Interpretation of results can be influenced by individual experience and perspectives.
Method
With DataChat, we can quickly and confidently address these challenges to find meaningful insights in our manufacturing data.
Load Data
Let's start by looking at the data we're working with. Upload the Machine Predictive Maintenance into your session. Note that this downloads as a .zip folder. Extract the contents of the .zip folder to upload the .csv file into DataChat.
Our resulting dataset should look something like this:
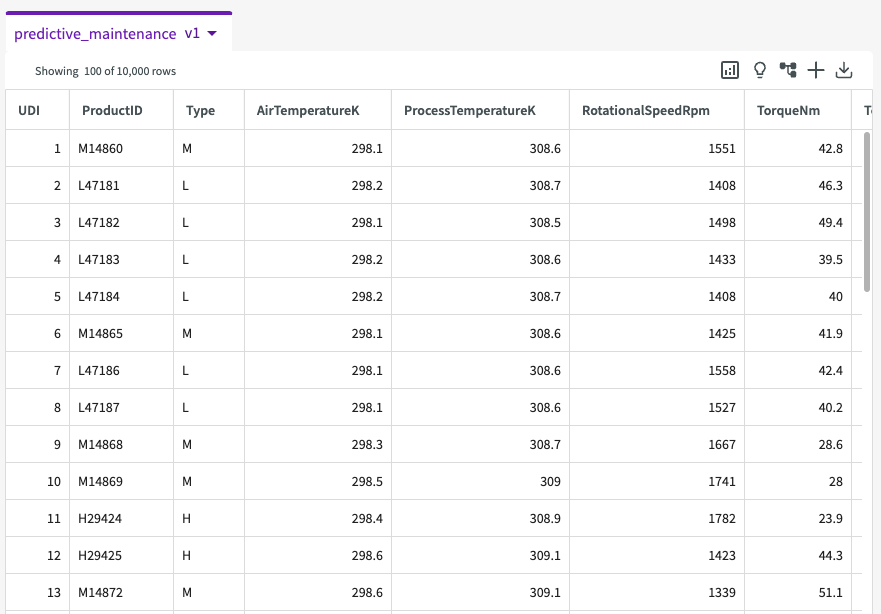
We have the following columns:
- UID. A unique identifier ranging from 1 to 10000.
- ProductID. The product ID and a letter "L" for low, "M" for medium, or "H" high as product quality variants.
- Type. Consists of a letter "L" for low, "M" for medium, or "H" high as product quality variants.
- AirTemperatureK. The air temperature generated.
- ProcessTemperatureK. The process temperature generated.
- RotationalSpeedRpm. The rotational speed calculated from power of 2860W.
- TorqueNm. The machine torque value.
- ToolWearMin. The minutes of tool wear in the process. A "machine failure" label indicates whether the machine has failed in this particular data point for any of the following failure modes are true.
- Target. If the machine failed or not.
- FailureType. The type of failure the machine has.
Investigate Data
Before proceeding with creating a model, let's first check that our data is healthy. Click Show Descriptive Statistics from the table header to provide quick summary statistics about our data, such as column minimums and maximums, unique values, and null values:

From here, we can see that more none of the columns in this dataset have missing or null values, meaning that we have valuable data points for each column. We can also see some other relevant information from these statistics, including 6 unique values for "FailureType" and 10,000 unique values for "UDI" and "ProductID". This will be helpful information later on.
Create Machine Learning Models
Since our data is clean, we can now use Train to determine which factors most impact machine failures. Click Machine Learning > Train Model in the skill menu, then:
- Select "Target" for the column.
- Select "ProductID", "UDI" and "FailureType" to as feature columns to exclude.
- Click Submit.
Our impact chart looks something like this:
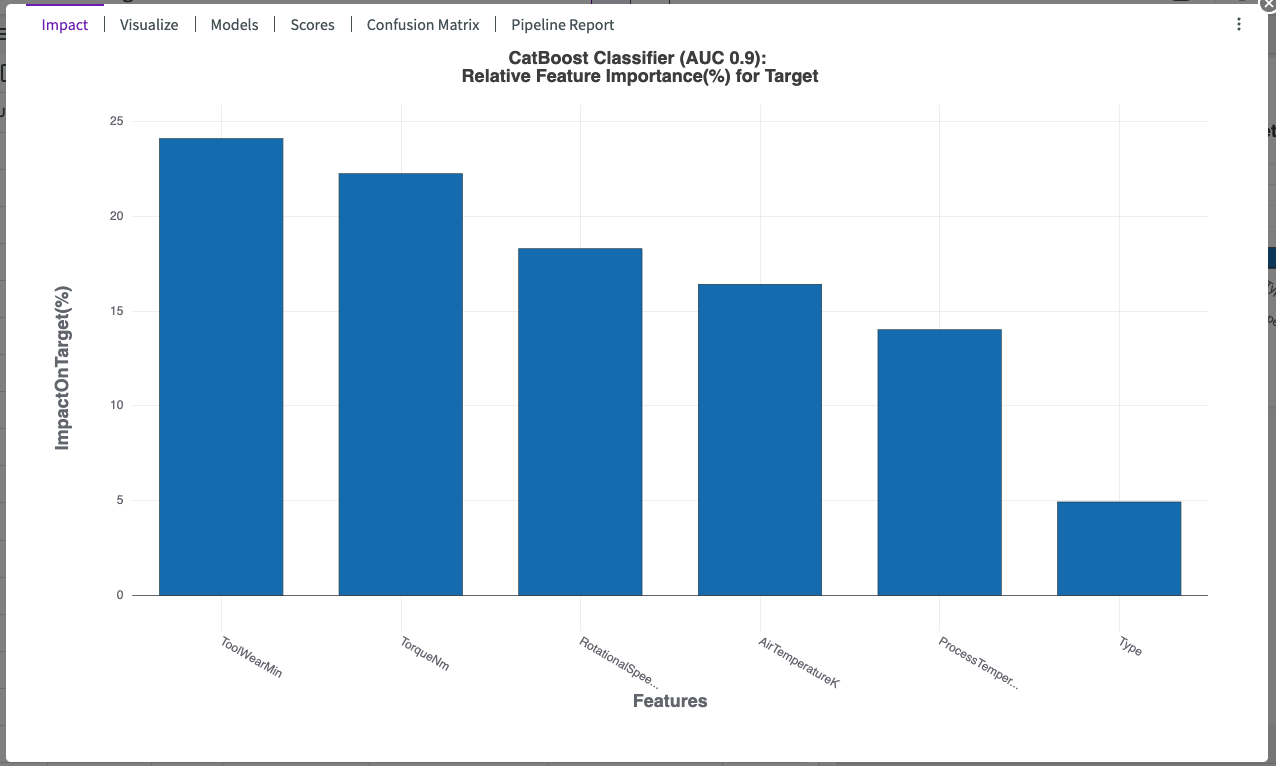
This impact chart shows us that "ToolWearMin", followed by "TorqueNm" and "RotationalSpeedRpm", has the highest impact on machine failure with 90% accuracy.
Let's investigate this output a bit more by navigating to the Visualize tab to view an auto-generated bar chart that looks like this:
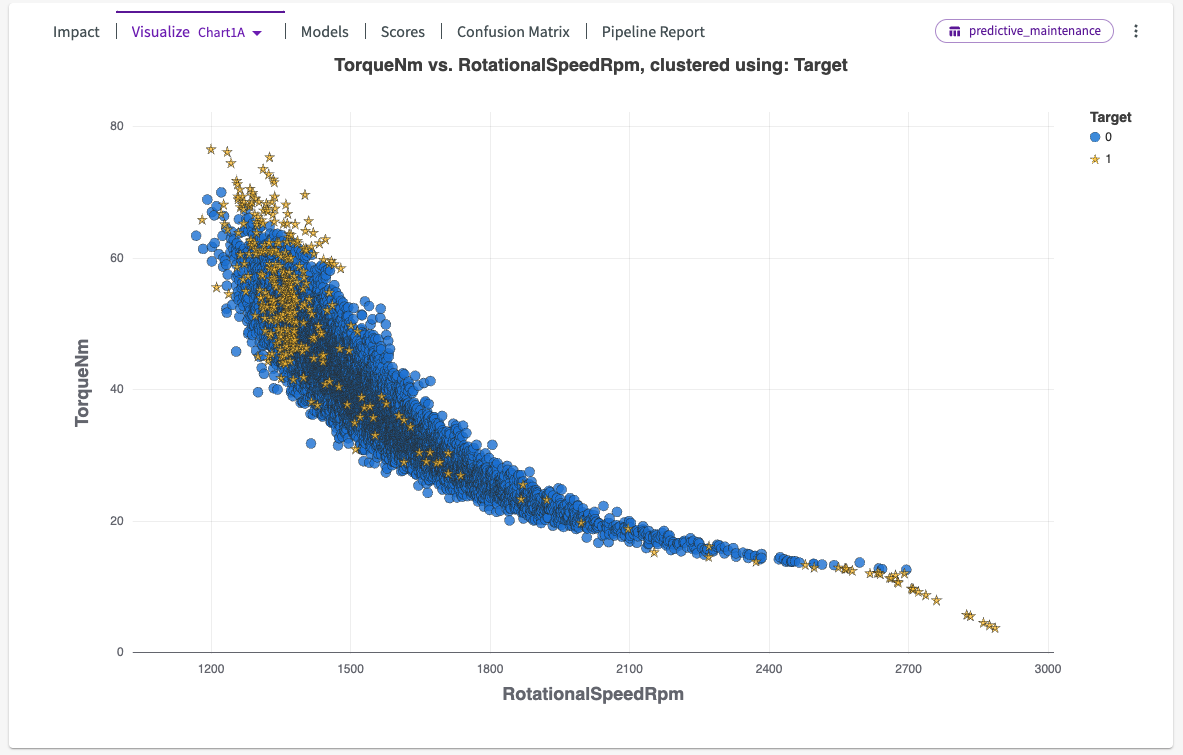
This scatter chart shows us that failures (stars) increase on both the higher and lower end of torque and rotational speed, with the least amount of machine failures shown in the mid-range.
Let's look at another chart. Click Chart 1B. This displays 5 donut charts, each one displaying the total amount of failures for each minute the tools have been running. We can see that the long the tools run, upwards of 3 minutes, the more likely a machine is to fail.
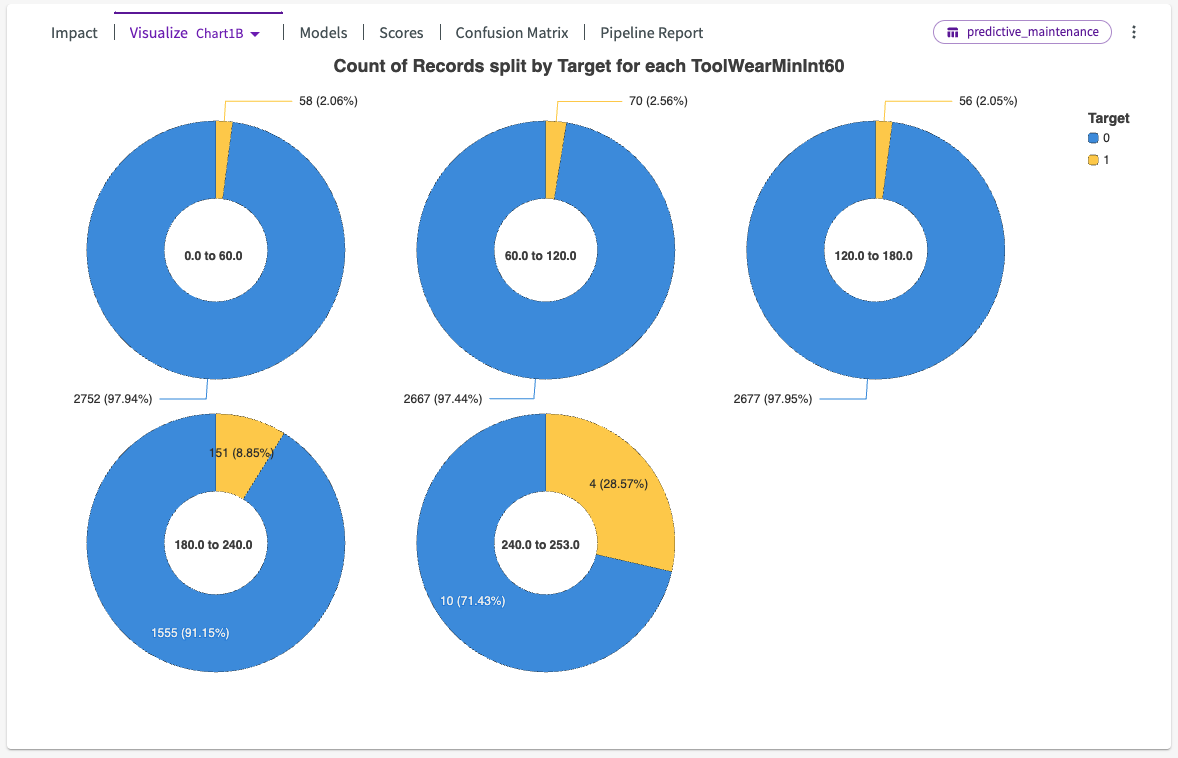
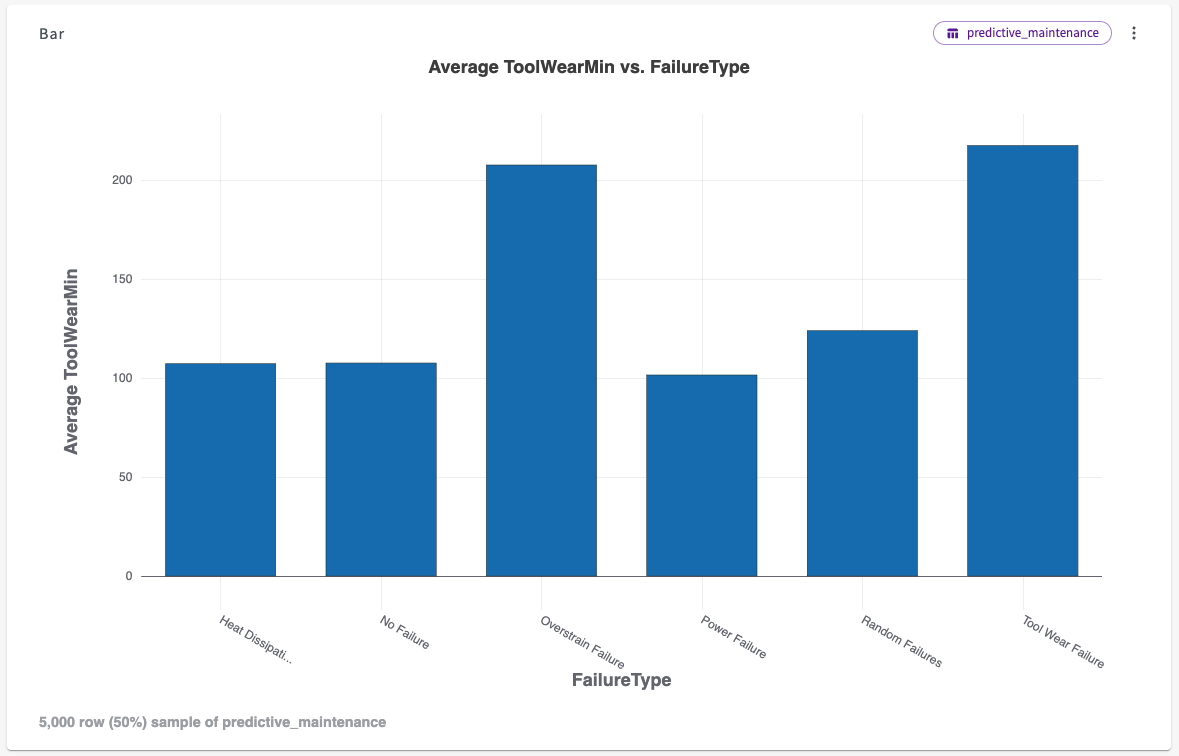
We can dive a bit deeper by creating more charts to determine which type of failure is occurring most frequently based on our previous findings. Click New Chart in the top left of the Chart tab, then:
- Select Bar Chart.
- Enter "FailureType" for the X-Axis.
- Enter "ToolWearMin" for the Y-Axis.
- Click Submit.
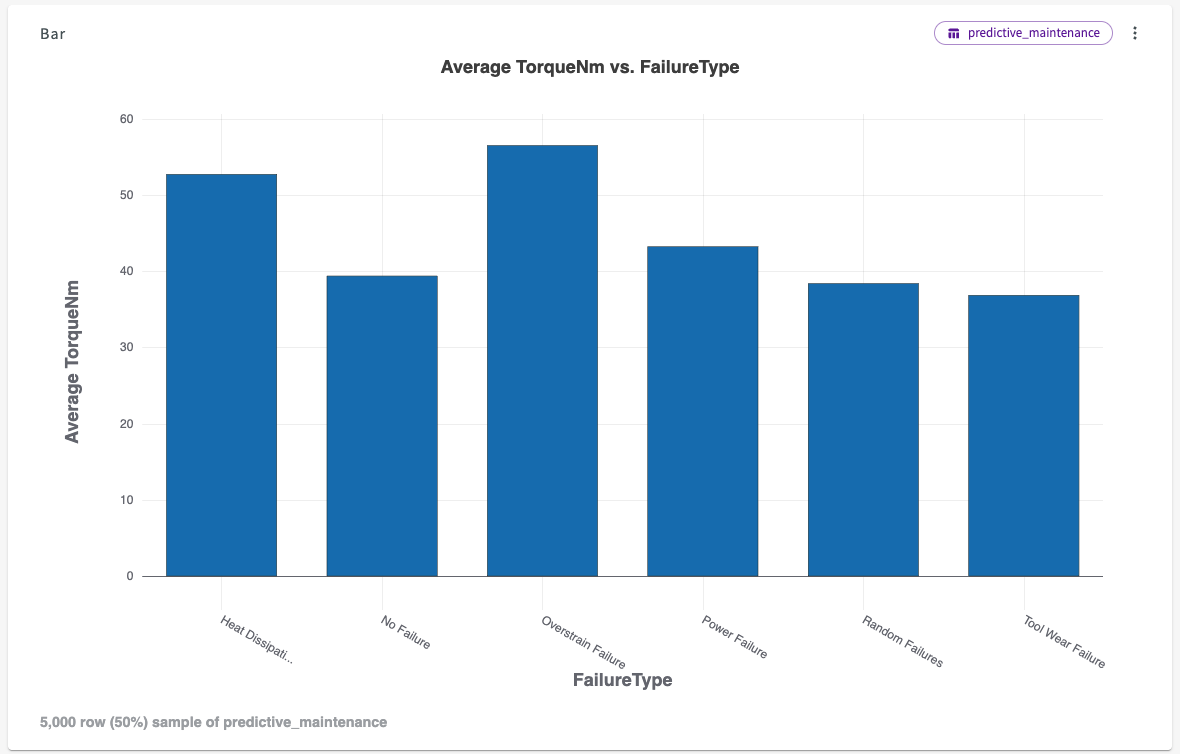
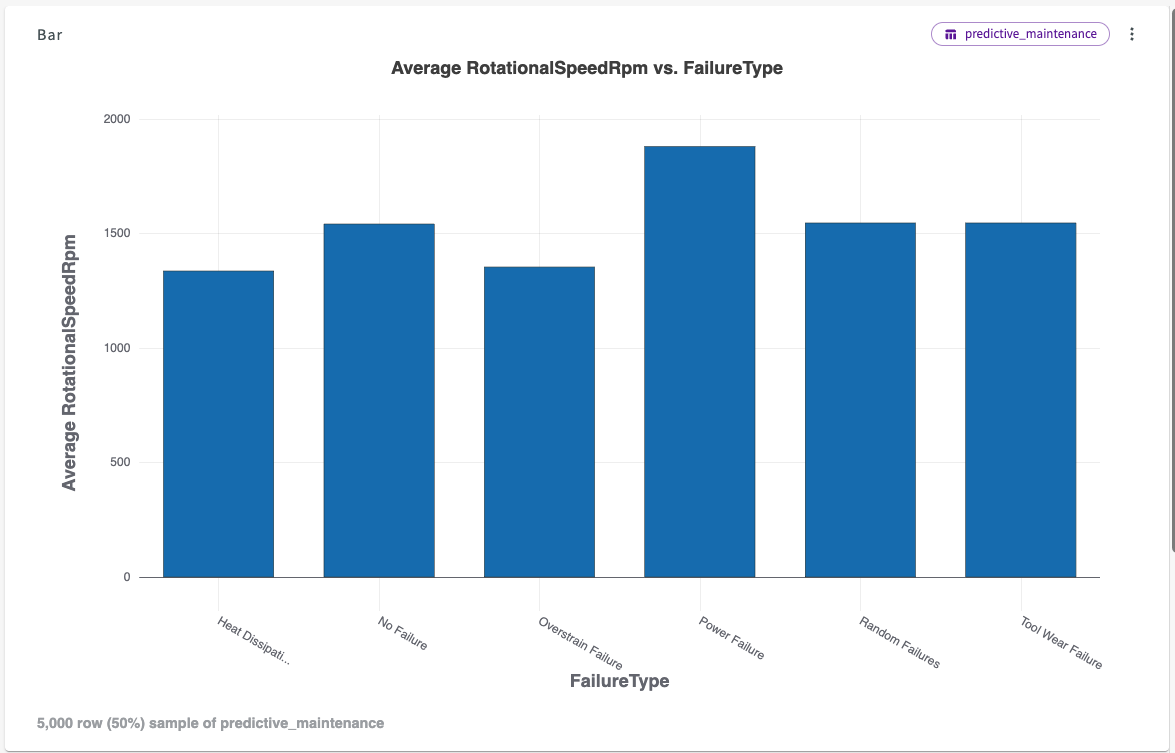
- Repeat steps 1-4, replacing the Y-Axis with "TorqueNm" and "RotationalSpeedRpm".
Our three charts look something like this:
Tool Wear per Minute
Torque
Rotational Speed
Results
Through our analysis, we have identified several factors that most influence machine failures, including:
- How long the tools have been running.
- The rotational speed of the machine.
- Torque created by the machine.
We have observed that machine failure is highest when torque and rotational speed are either very low or very high, and that the longer the machine tools run, the more likely the machines are to fail. We also observed how these variables impact the type of failure:
- Tool wear increases the likelihood for tool wear failure and overstrain failure.
- Torque increases the likelihood for overstrain failure and heat dissipation failure.
- Rotational speed increases the likelihood for power failure and tool wear failure.
Based on these findings, we can recommend several actionable steps to improve the manufacturer's machine functionality:
- Focus on keeping the machines tools running for no longer than 3 minutes at a time.
- Ensure that the rotational speed of the machine stays between 1500W and 2700W.
- Maintain the machine torque between 9Nm and 30Nm.
- Invest in on-call repairs that focus on power failure, tool wear failure, and overstrain failure.