Sales
In this section, we'll investigate anonymized store sales data using a retail data analytics dataset.
Holiday sales are a critical period for many businesses, often accounting for a significant portion of annual revenue. Around holidays, consumer spending typically increases, driven by factors such as gift-giving, holiday bonuses, and seasonal promotions. Understanding the differences in sales trends between holiday and non-holiday periods can offer valuable insights for optimizing marketing strategies and driving sales.
Questions
We'll address the following questions:
- Do holiday weeks or non-holiday weeks result in higher sales, and which departments benefit the most?
- How do markdowns impact sales?
Challenges
Analyzing sales data involves several challenges:
- Data volume. Large datasets can be cumbersome and require efficient data processing techniques.
- Limited historical data. Evaluating the impact of events that occur infrequently can be difficult.
- Data quality. Inconsistent or missing data can lead to inaccuracies in the analysis.
Method
With DataChat, we can quickly and confidently address these challenges to find meaningful insights in our data. Using this data, we will investigate holiday and markdown sales to see if we can develop strategic planning and resource allocation for next year's holidays.
Load Data
To start, download the Retail Data Analytics datasets. Note that these download as a .zip file. Unzip the file and upload the datasets into a session.
Once loaded, the datasets should look something like this:
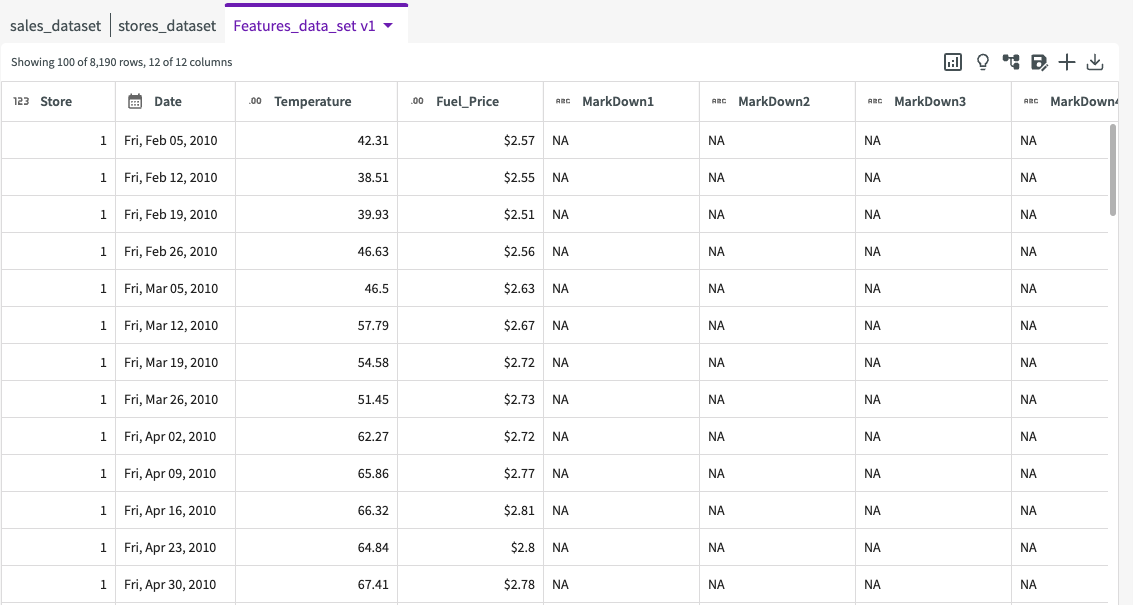
We have three datasets:
- stores_dataset. Anonymized information about the 45 stores, indicating the type and size of store.
- Features_data_set. Data related to the store, department, and regional activity.
- sales_dataset. Historical sales data from 02/05/2010 to 11/01/2012.
The datasets contain the following columns:
-
stores_dataset:
- Store. The store number.
- Type. The store type (A, B, or C).
- Size. The store size (sq ft).
-
Features_data_set:
- Store. The store number.
- Date. The date.
- Temperature. Average temperature of the region.
- Fuel_Price. The cost of fuel in the region.
- MarkDown1-5. Anonymized data denoting whether a markdown was present.
- CPI. Consumer price index of the region.
- Unemployment. The unemployment rate of the region.
- IsHoliday. Whether the week contains a holiday.
-
sales_dataset:
- Store. The store number.
- Dept. The department number.
- Date. The date.
- Weekly_Sales. The weekly sales ($) for a given department.
- IsHoliday. Whether the week contains a holiday.
Clean Data
Join Tables
To get a full picture of influence, we will work with all three datasets. Let's start by asking the Data Assistant to "join all tables".
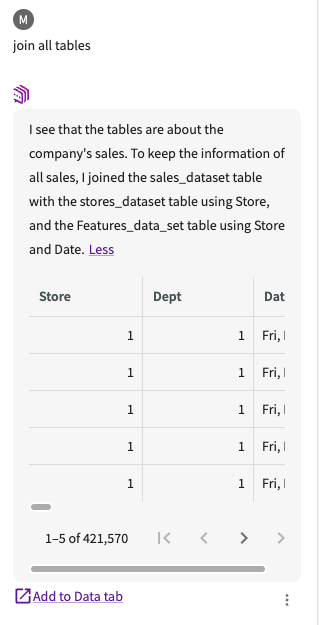
The Data Assistant returns a joined table in the conversation history. Click Add to Data tab to add it to our existing datasets.
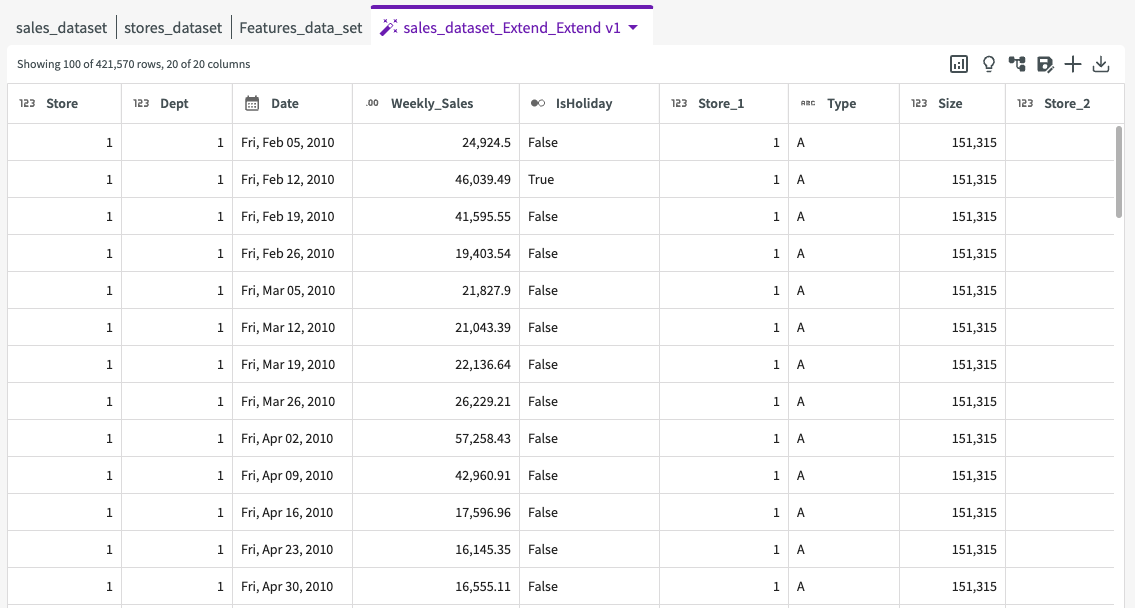
Drop Columns
From this table, we can see that all of our columns were joined together. However, this process resulted in some duplicate columns: "Store_1", "Store_2", "Date_1", and "IsHoliday_1". Let's remove these duplicate columns before proceeding.
-
Click Wrangle > Drop Columns in the Skill menu.
-
Select the following columns to drop:
- Date_1
- IsHoliday_1
- Store_1
- Store_2
-
Click Submit

The resulting dataset no longer contains the dropped columns:
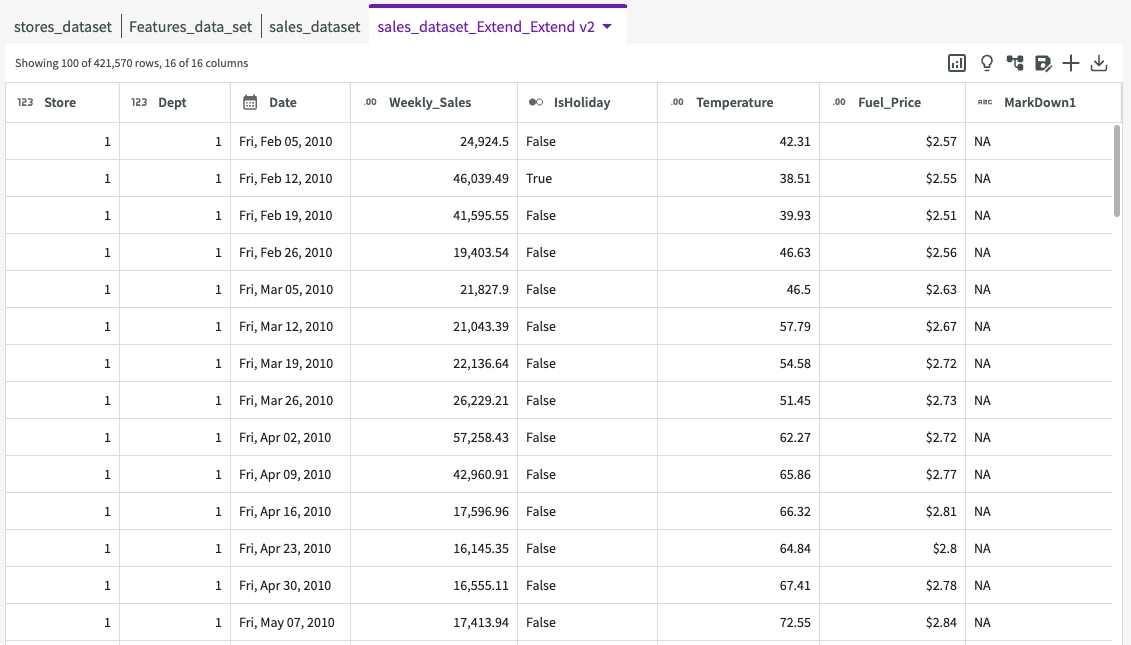
Create Columns
Scrolling to the right reveals that the columns "MarkDown1," "MarkDown2," "MarkDown3," "MarkDown4," and "MarkDown5" contain many "NA" values. The other values in these columns simply indicate the presence of a markdown. Let's create a new column to represent the presence of markdowns each week as true or false, clearly indicating if a markdown was present each week.
-
Click Add Column > Using Conditional Values in the Skill menu.
-
Enter "MD1" for the new column name.
-
Select "False" for the value, "MarkDown1" for the column, "contains" for the expression, and "NA" for the value.
-
Click Add Another Option.
-
Select "True" for the value, "MarkDown1" for the column, "does not contain" for the expression, and "NA" for the value.
-
Select "False" for the default value.
-
Click Submit.
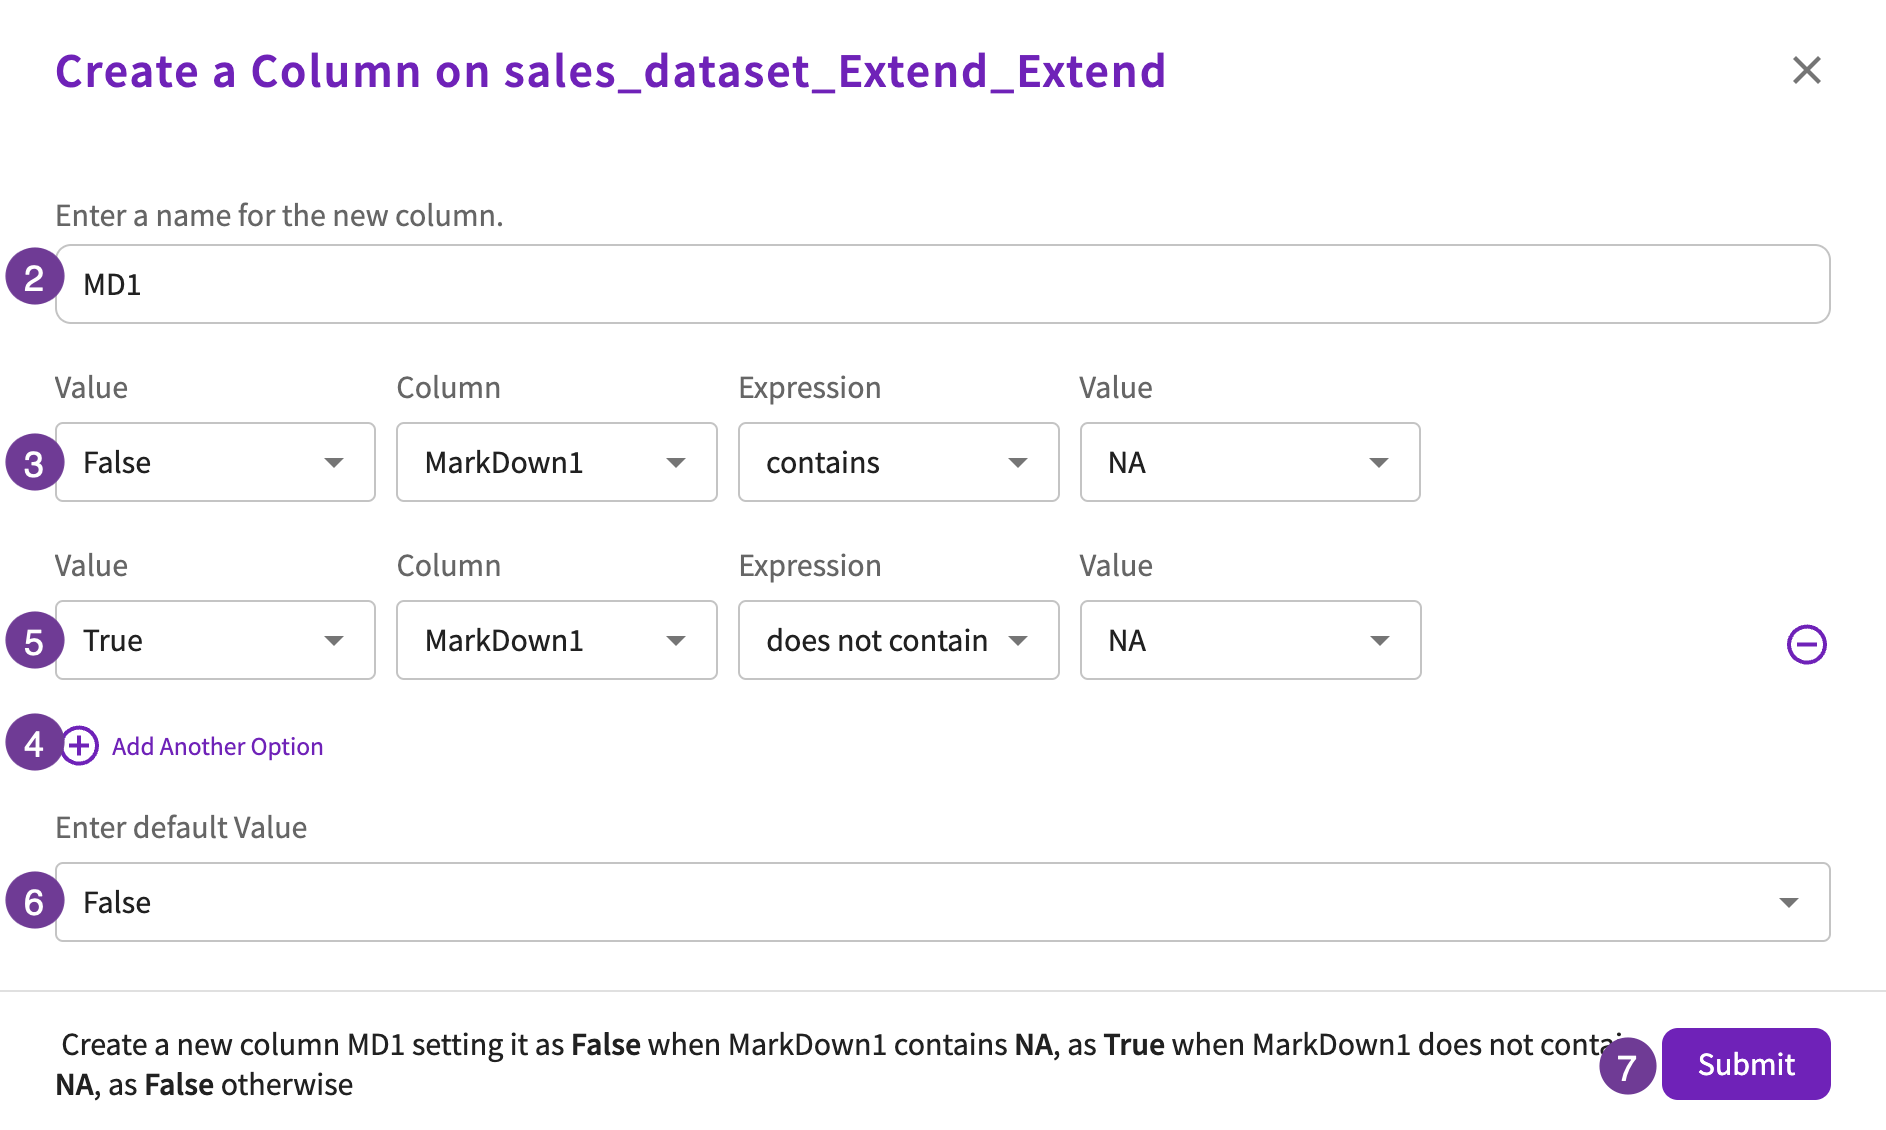
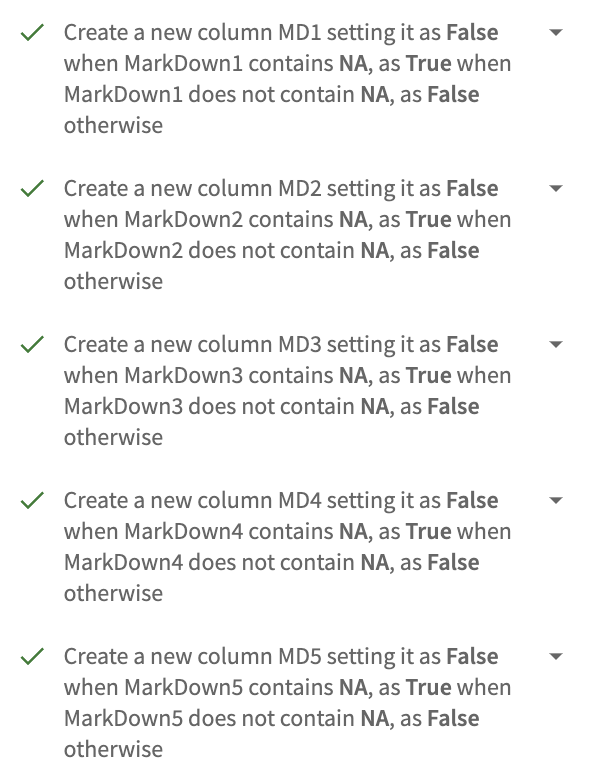
This adds a boolean column, "MD1," indicating whether a markdown was present each week. Repeat steps 1-7 for the remaining markdown columns, naming them "MD2", "MD3", "MD4", and "MD5". The conversation history once complete should look like this:
Drop Columns
Because we now have these new columns to indicate whether a markdown occurred, we can remove the old markdown columns.
-
Click Wrangle > Drop Columns in the Skill menu.
-
Select the following columns to drop:
- MarkDown1
- MarkDown2
- MarkDown3
- MarkDown4
- MarkDown5
-
Click Submit

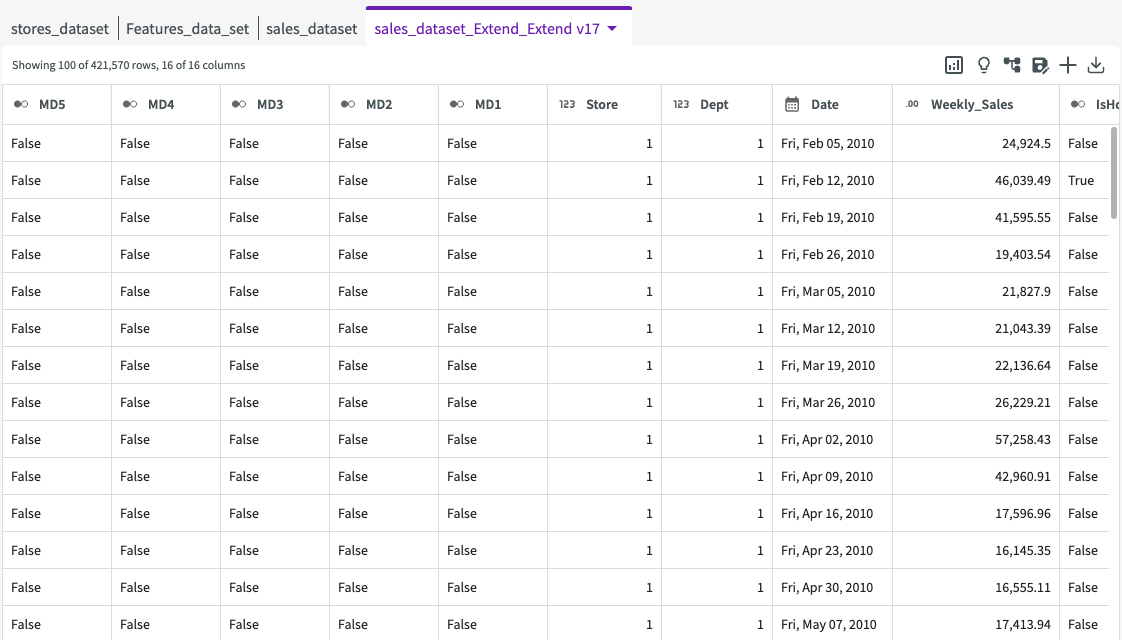
The resulting dataset no longer contains the dropped columns:
Investigate Holiday Sales
Pivot Tables
Now that we've cleaned up our data, we can dive into analysis. We can click Show Me Something Interesting to view some insights that might be helpful in our analysis of holiday sales.
Click Total Sales by Store and Holiday. Note that you may need to refresh the suggestions or ask "Pivot on total weekly sales, creating rows from store and columns from holiday" to generate this insight.
This creates a pivot table that is displayed in the Chart tab:
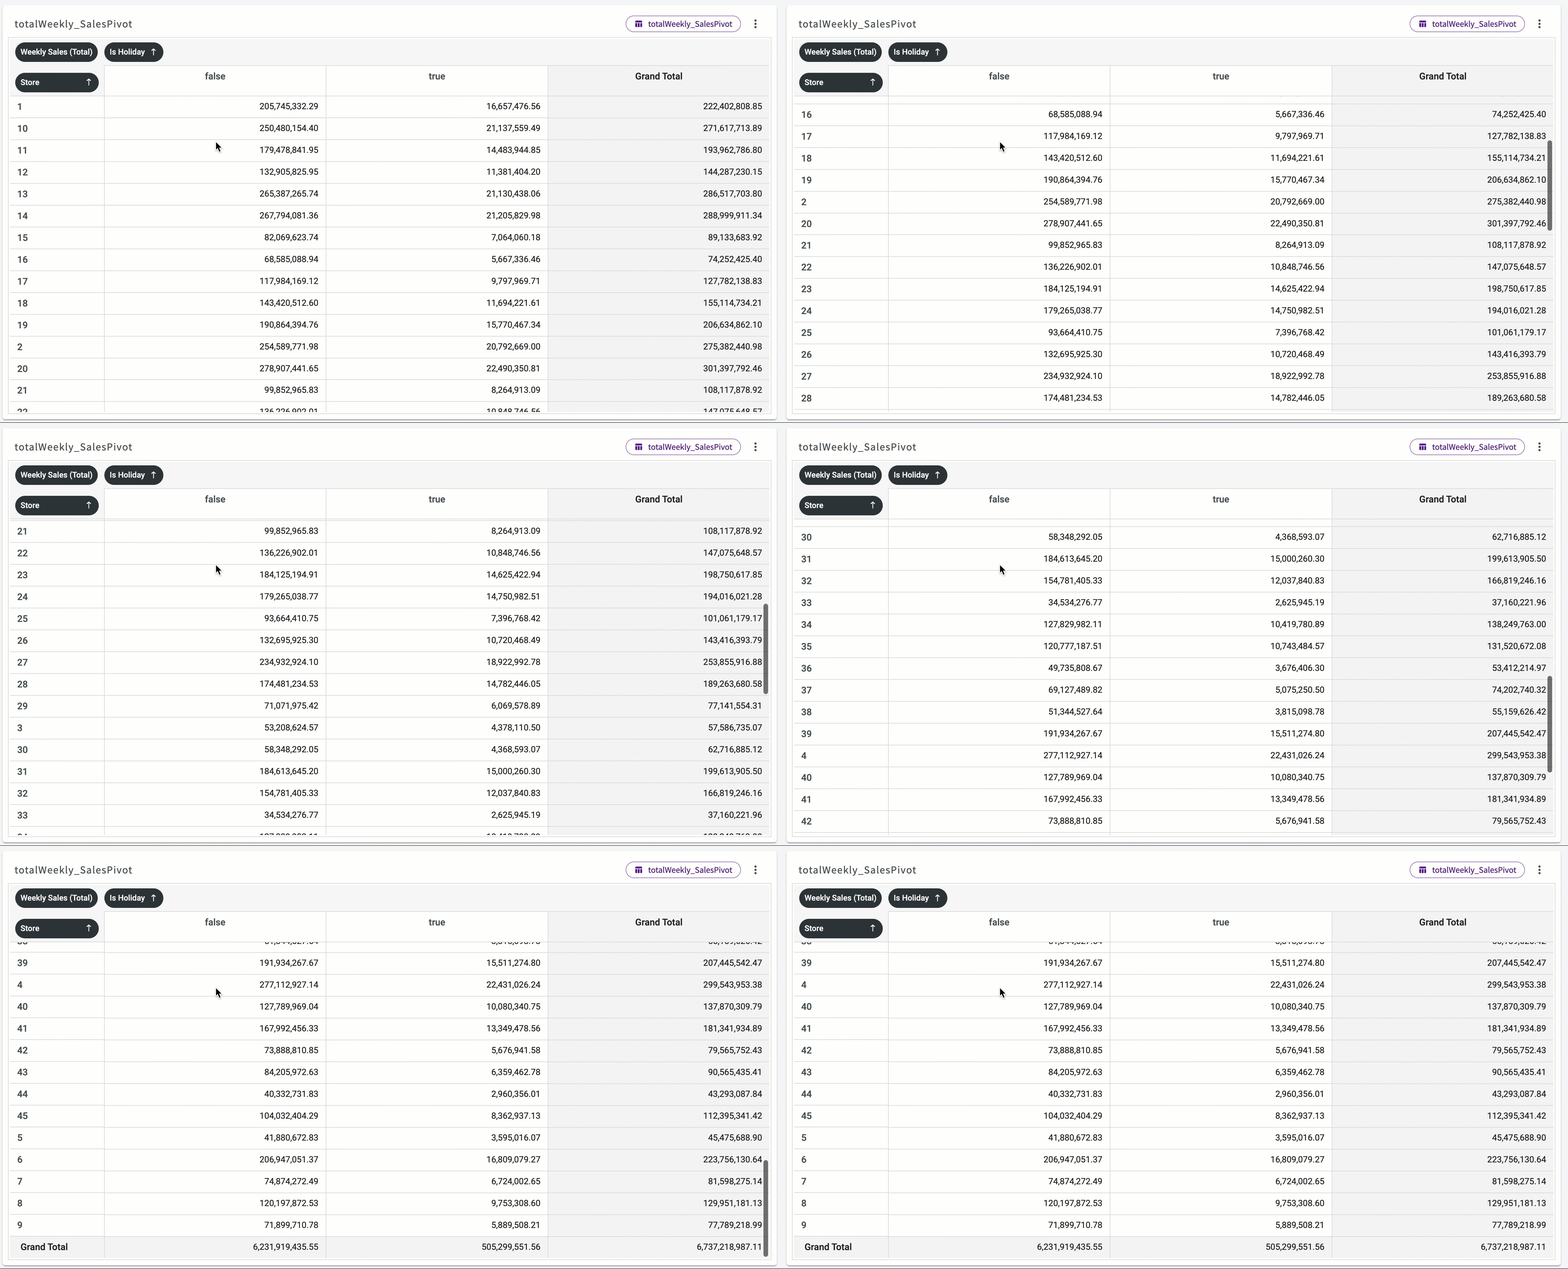
From this pivot table we can view total sales for each across holiday weeks and non-holiday weeks. If we scroll to the Grand Total row, we can see that the holiday weeks account for $505,299,551.65 of $6,737,218,987.11, or about %7.5 of total sales.
Aggregate Data
Let's investigate this a bit further by looking at how different departments benefit from holiday sales. Navigate back to the Data tab, then ask the Data Assistant to "Compute the total weekly sales for each holiday and department".
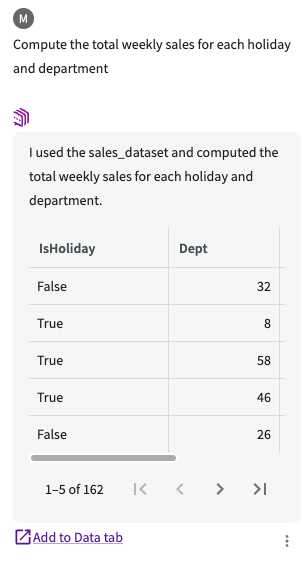
The Data Assistant returns a dataset with the sales computations in the conversation history. Click Add to Data tab to add it to our existing datasets.
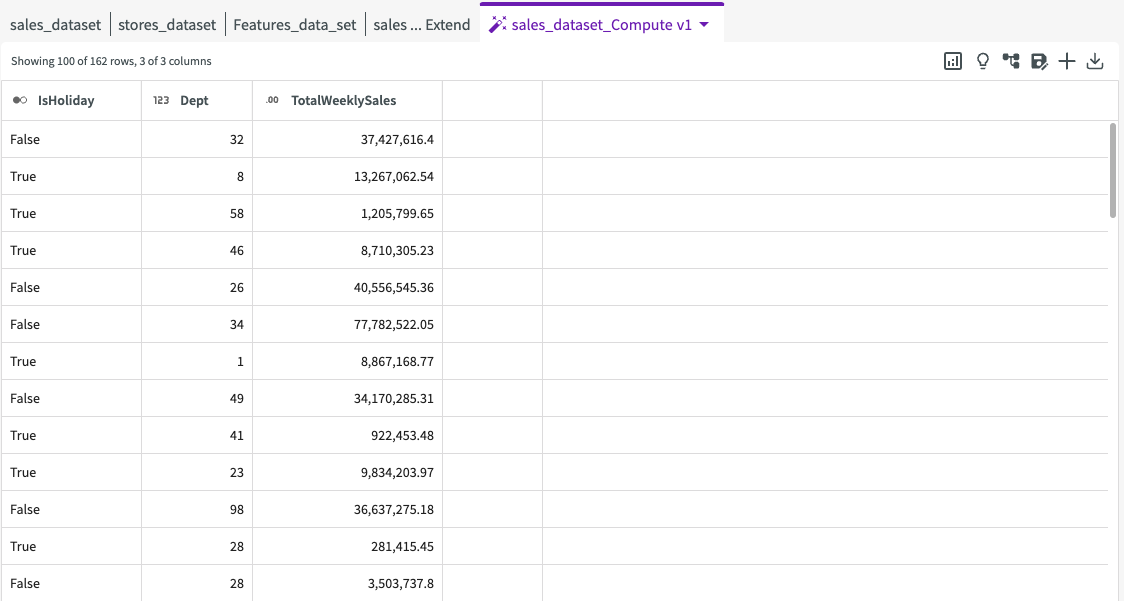
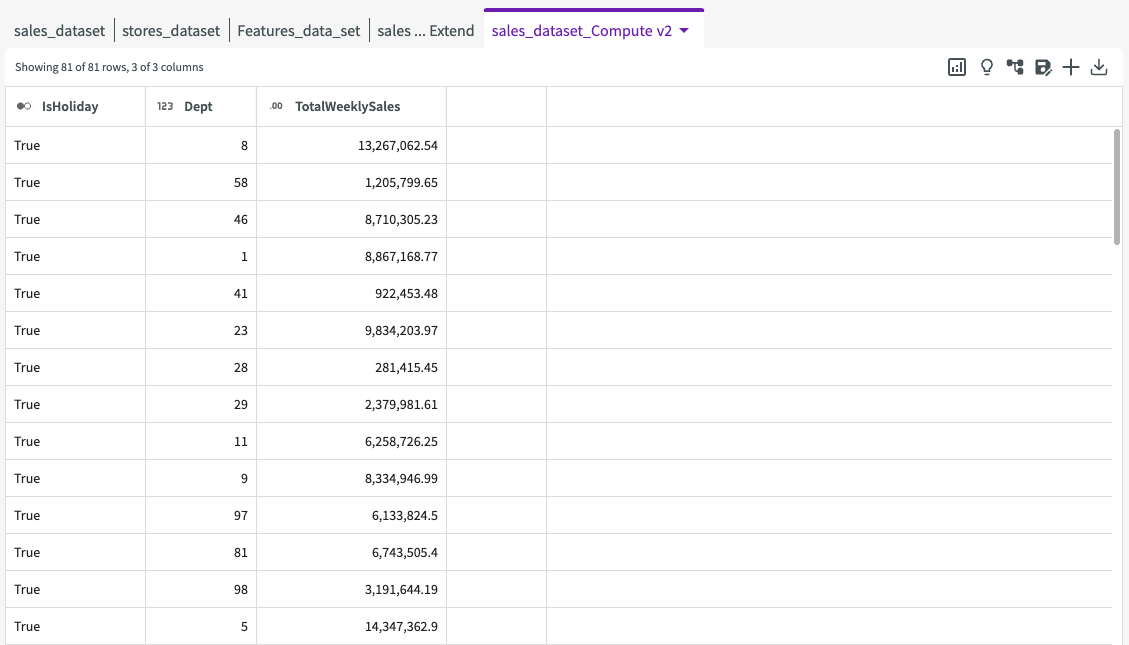
Since we want to only view data on holiday weeks, let's drop the rows where holiday is false:
- Click Wrangle > Drop Rows in the Skill menu.
- Select "IsHoliday" for the column.
- Select "is equal to" for the expression.
- Select "the value" for the value type.
- Enter "False" for the value.
- Click Submit.

The resulting dataset only displays data from holiday weeks:
Let's sort the rows in descending order to view which departments perform best. Click the More menu > Sort > descending icon on the "TotalWeeklySales" column:
The resulting dataset looks like this:
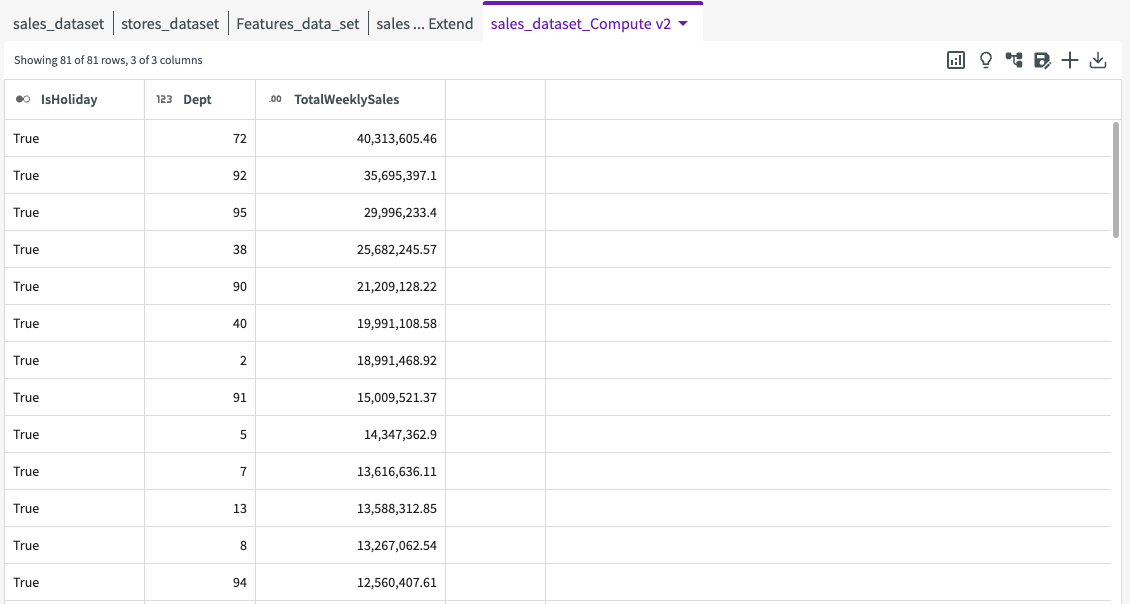
This reveals that departments 72, 92, 95, 38, and 90 have the highest total sales during holiday weeks. But how does it compare to average sales during other weeks?
Create Visualizations
Let's create a visualization to illustrate this question. Navigate to the "sales_dataset_Extend_Extend" dataset to set it as the current dataset, then click Plot Chart in the skill menu:
- Select "Bar Chart" for the type.
- Under Required Fields, select "Dept" for the X-Axis and "Weekly_Sales" for the Y-Axis.
- Under Optional Fields, select "IsHoliday" for the Group.
- Click Submit.
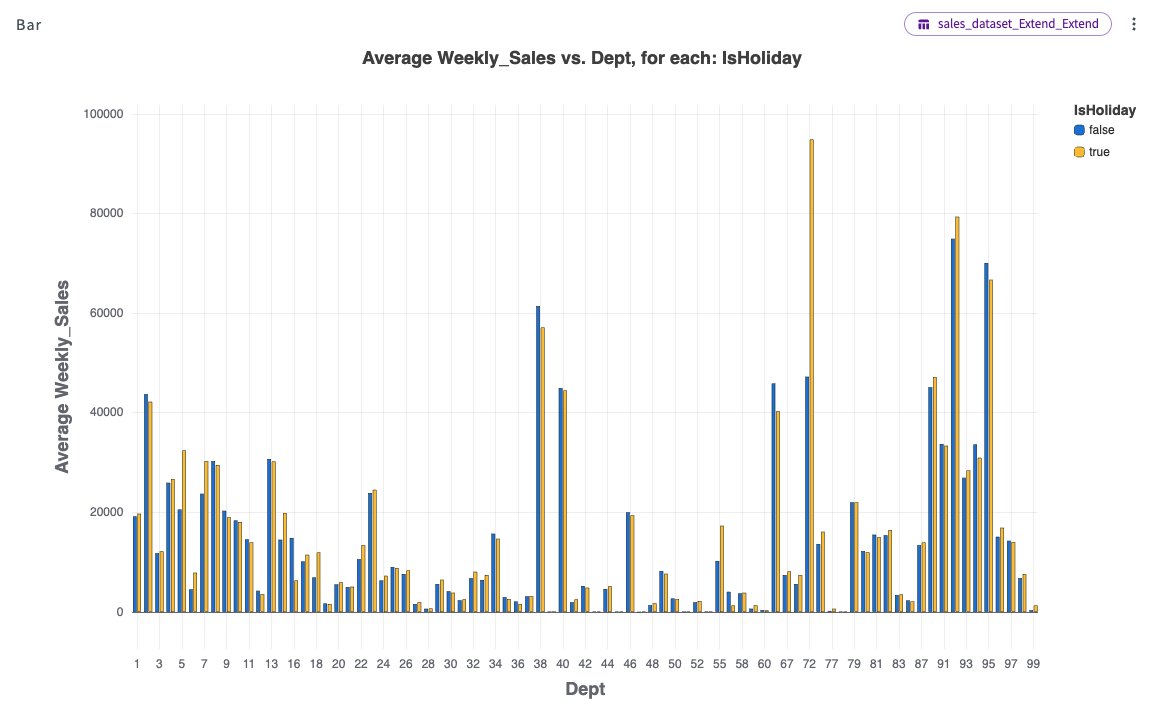
This chart reveals that sales during holiday weeks are comparable, and on occasion higher than sales during non-holiday weeks, indicating that holiday weeks don't seem to have a particular impact on overall sales.
Investigate Markdown Sales
Aggregate Data
Let's see how markdown sales compare to holiday sales. Navigate back to the "sales_dataset_Extend_Extend" dataset, then:
-
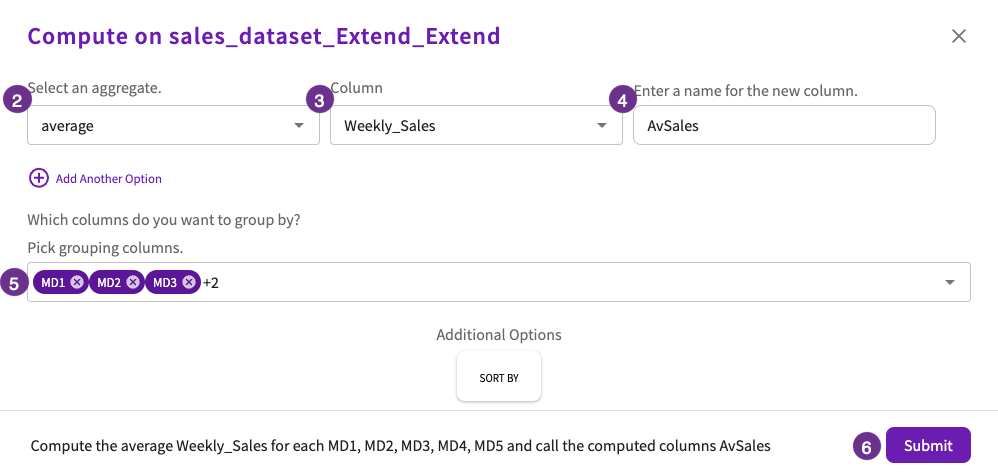
Click Aggregate > Compute in the Skill menu.
-
Select "average" for the aggregate.
-
Select "Weekly_Sales" for the column.
-
Enter AvSales for the new column name.
-
Select "MD1", "MD2", "MD3", "MD4", and "MD5" for the columns to group by.
-
Click Submit.
The resulting dataset looks like this:
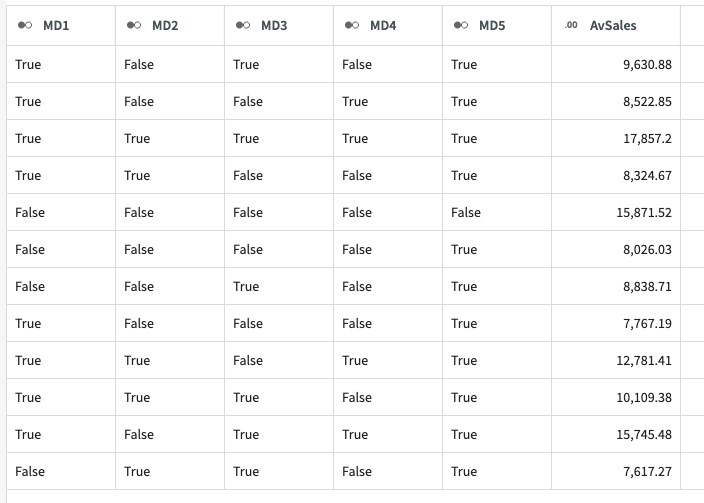
From this dataset we can see that average weekly sales are highest when all five markdown types are present, followed by when all markdown types are not present. Overall, we do see a trend of increasing sales when "MD1", "MD3", and "MD5" are present at the same time.
Create Visualizations
From here, we can create some more charts to visualize the different markdown columns. Navigate back to the "sales_dataset_Extend_Extend" dataset, then:
-
Click Plot Chart in the Skill menu.
-
Select Heatmap for the type.
-
Select "Store" for the X-Axis.
-
Select "Weekly_Sales" for the density.
-
Cycle through all markdown columns for the Y-Axis to view the differences.
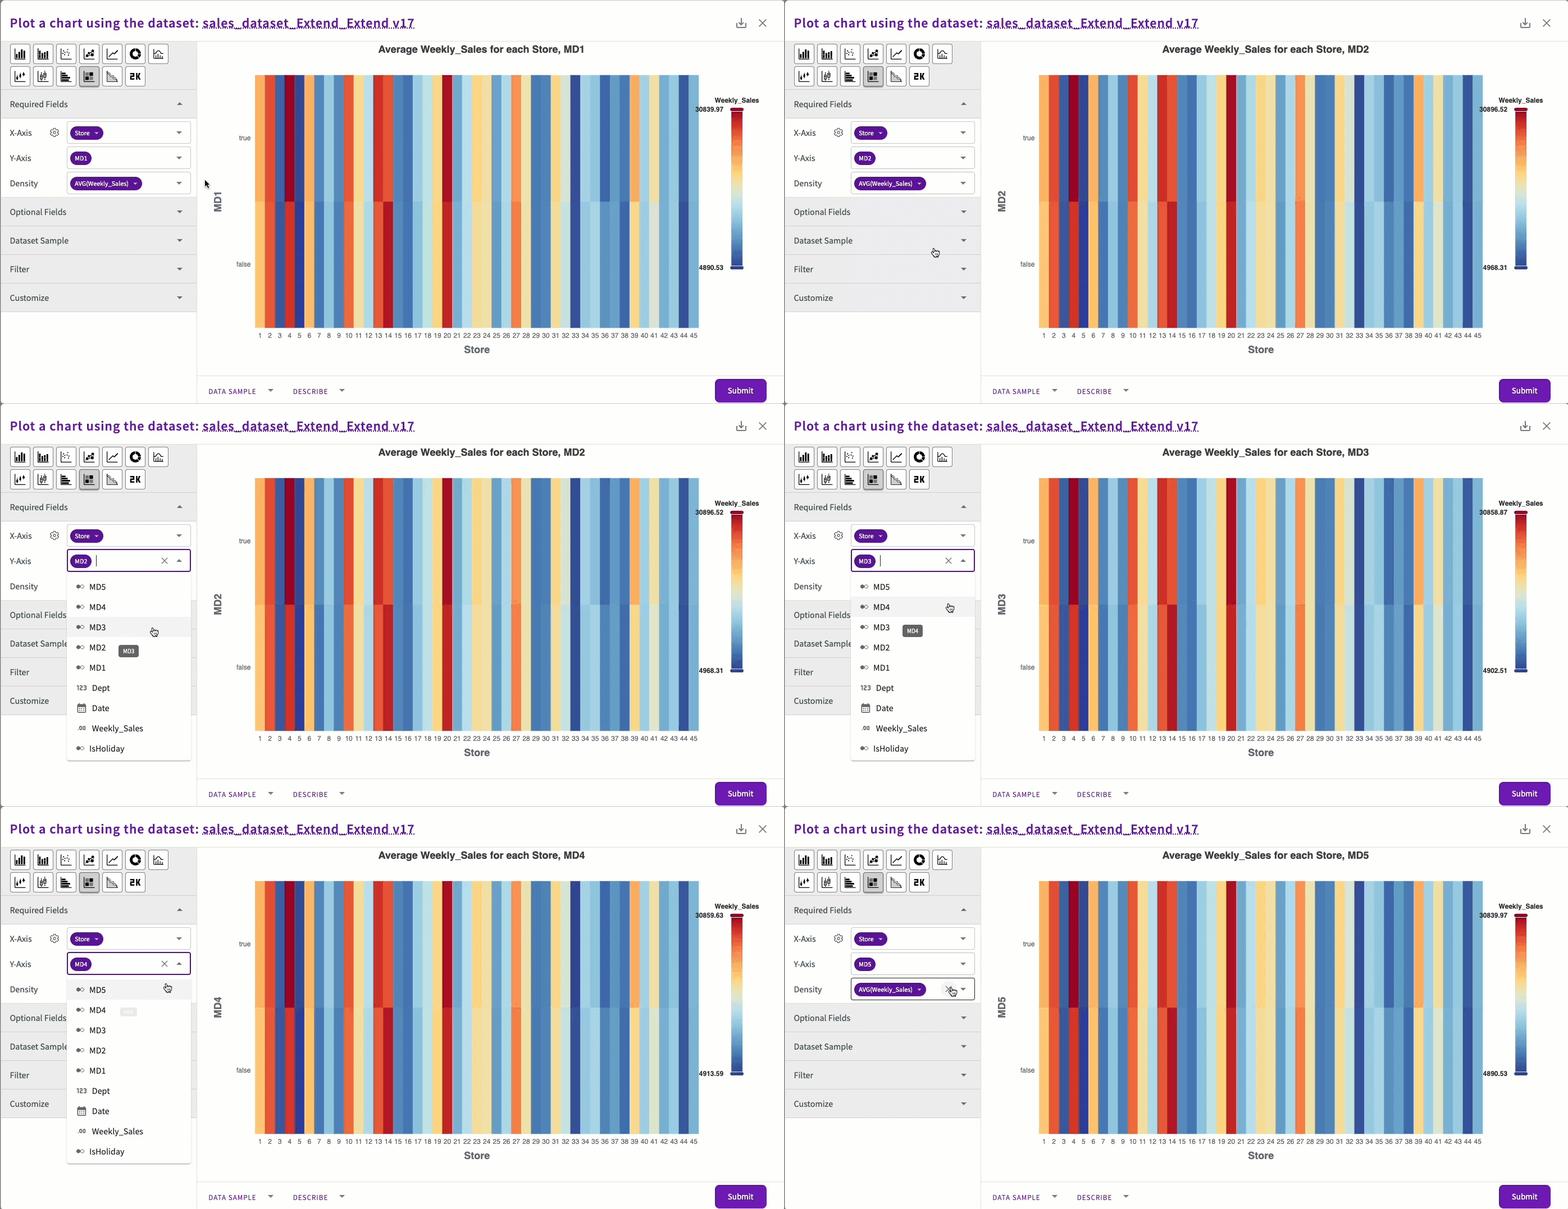
These charts show that while average weekly sales with and without markdowns are often similar, stores running markdowns consistently achieve slightly higher average sales across all markdown types.
Findings
The analysis of sales data reveals insights into how different factors such as holidays, markdowns, and department-specific performance impact overall sales. The following sections break down these findings to highlight key trends.
Holiday vs. Non-Holiday Sales
Our investigation into holiday vs. non-holiday sales reveals that holiday weeks account for approximately 7.5% of total sales, indicating a minimal difference compared to non-holiday weeks. However, specific departments such as 72, 92, 95, 38, and 90 show the highest total sales during holiday weeks. This suggests that while overall sales may not fluctuate significantly, certain departments experience notable increases.
Markdown Sales
Markdown strategies are important in driving sales. Our analysis shows that average weekly sales are highest when all five markdown types are present. Additionally, stores running markdowns consistently achieve slightly higher average sales compared to those not running markdowns.
Department Performance
The performance of various departments reveals that Certain departments benefit more during holiday weeks, suggesting that targeted promotions could help capitalize on these peaks.
Solutions
Based on our findings, hypothetical solutions could include:
- Invest in marketing efforts across all departments, with increased spend for departments 72, 92, 95, 38, and 90 during holiday weeks to maximize sales.
- Introduce bundled offers or discounts on popular and markdown items in these departments.
- Implement and monitor markdown strategies more effectively by running different markdowns concurrently, especially during holiday weeks.