Handle Different Types of Outliers
Outliers can represent measurement errors, entry errors, poor sampling, and more. They can have a large impact on your analysis and can skew your findings. In DataChat, we can:
- Find outliers by creating visualizations to view outliers in plots.
- Handle outliers by replacing or removing numerical outliers or null values.
In this section, we’ll use data about healthy city lifestyles to show how to find and handle numerical outliers and null values.
Load Our Data
To start, Load the Healthy Lifestyle Cities Report 2021 dataset. Note that this downloads as a .zip folder. Extract the contents of the .zip folder and upload the .csv file into DataChat.
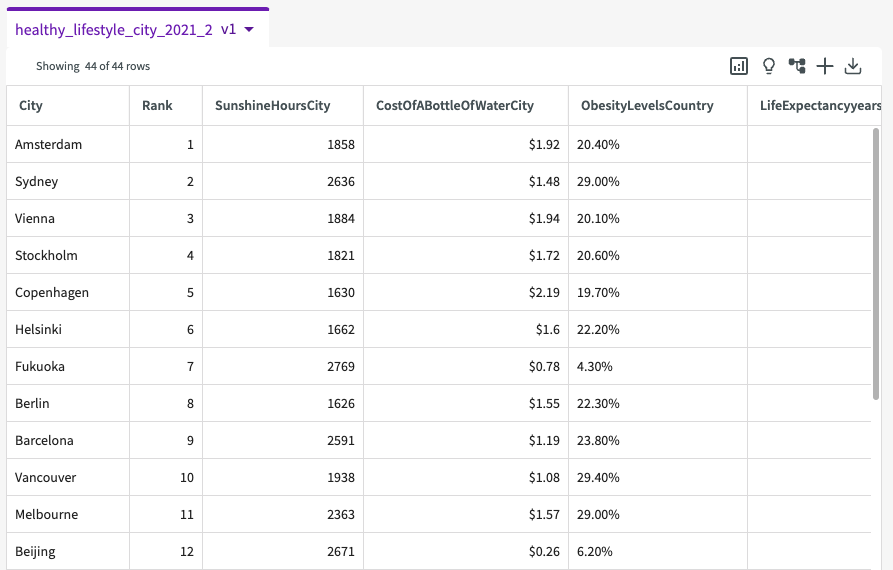
Visualize Our Data
With our data loaded, we can create a visualization to see if there are any visible outliers in the data:
-
Click Plot Chart in the skill menu to open the Chart Builder.
-
Select Scatter from the chart options. Violin and boxplot charts are also suggested options to view outliers.
-
Enter “SunshineHoursCity” in the X-Axis field, and “LifeExpectancyyearsCountry" in the Y-Axis field.
-
Click Submit.
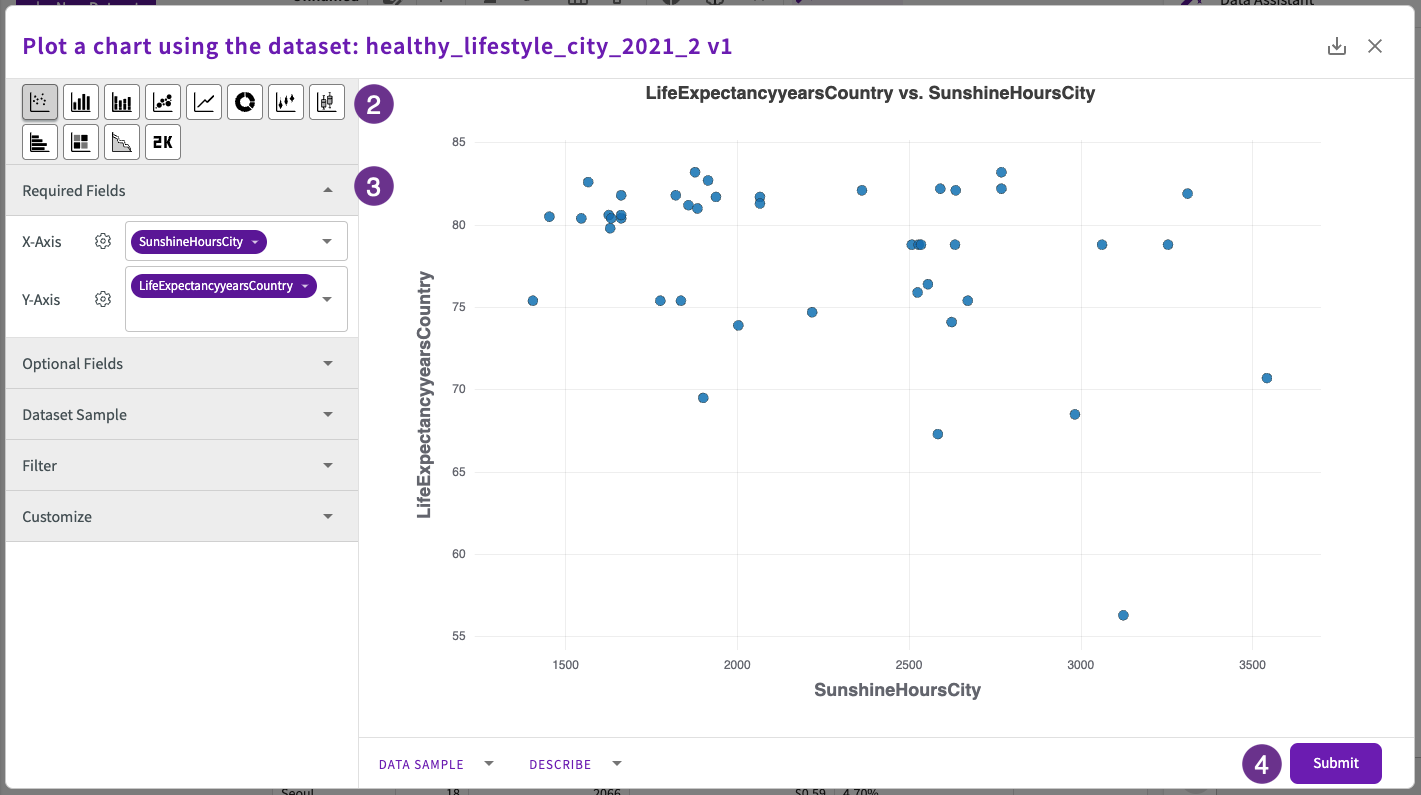
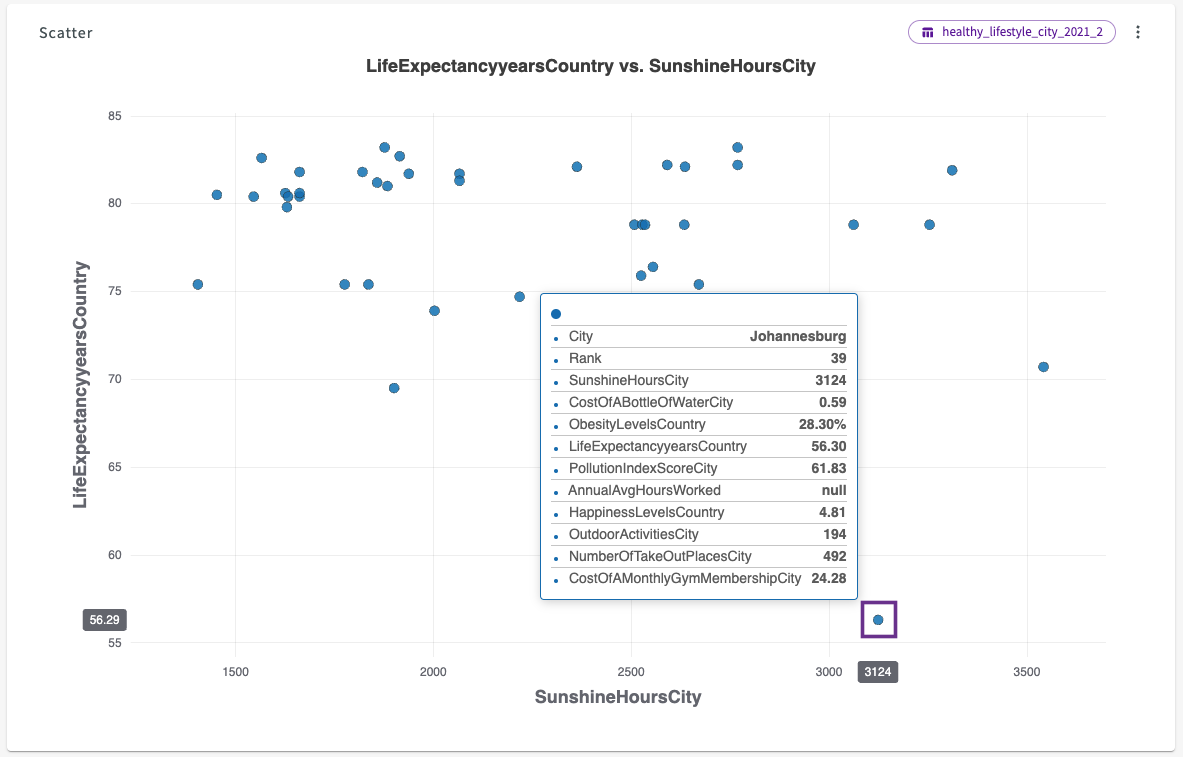
From the plot, we can see that Johannesburg is a distinct outlier that doesn’t align with the rest of the cities.
Remove Outliers
Let’s remove this outlier from our dataset. Navigate back to the Data tab, then:
-
Click Wrangle > Drop Rows in the skill menu.
-
Select “City” for the column, “contains” for the expression, and “Johannesburg" for the predicate value.
-
Click Submit.
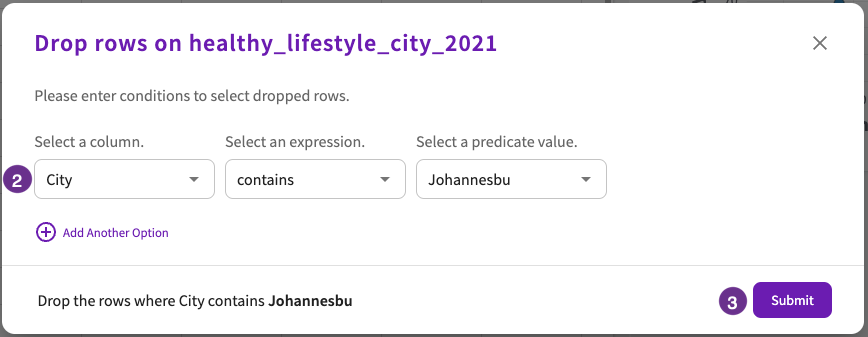
This creates a new dataset, “healthy_lifestyle_city_2021 v2”, with the “Johannesburg” row dropped.
Replace Null Values
From here, we can also handle null values in our target columns. There are no null values in the LifeExpectancyyearsCountry column, but there is one null value in the the SunshineHoursCity column where "City" is "Geneva".
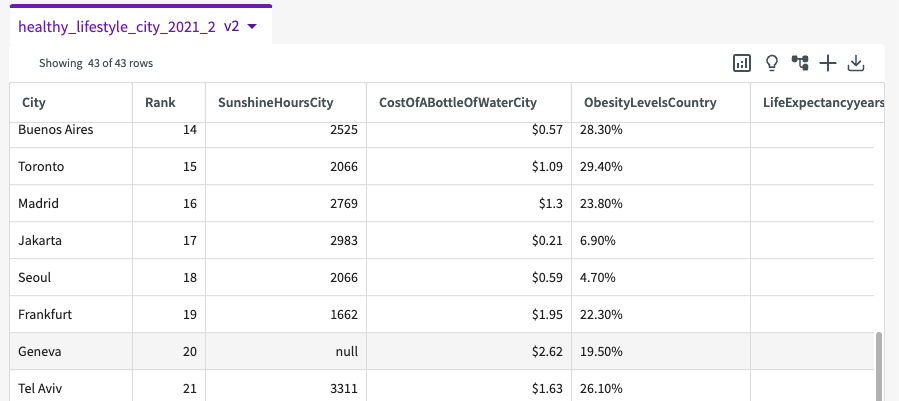
We can replace this null value with an average using the Clean form:
-
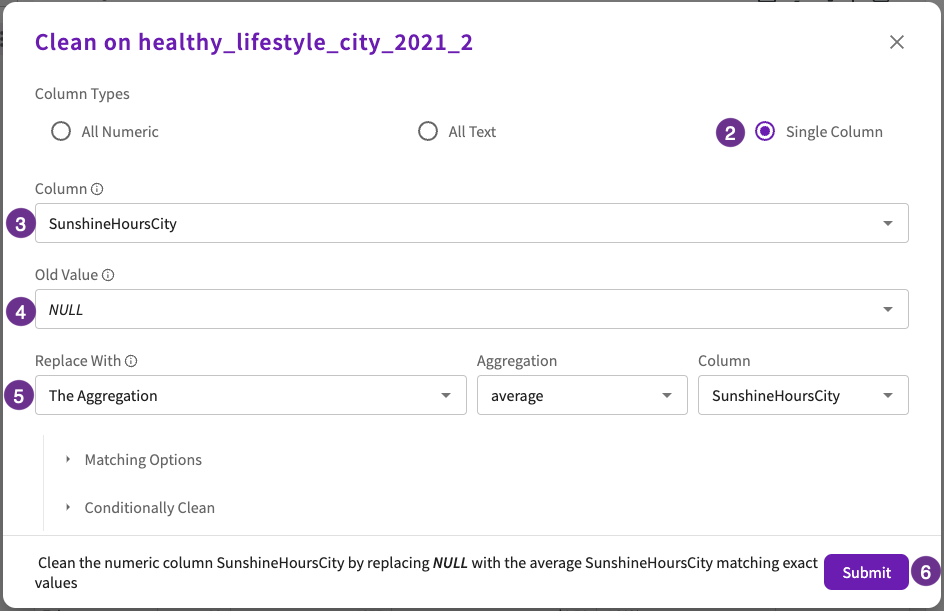
Click Wrangle > Clean in the skill menu.
-
Select Single Column.
-
Enter "SunshineHoursCity" for the column to clean.
-
Enter "NULL" for the old value.
-
Select "The Aggregation", "average" and "SunshineHoursCity" for the value to replace with.
-
Click Submit.
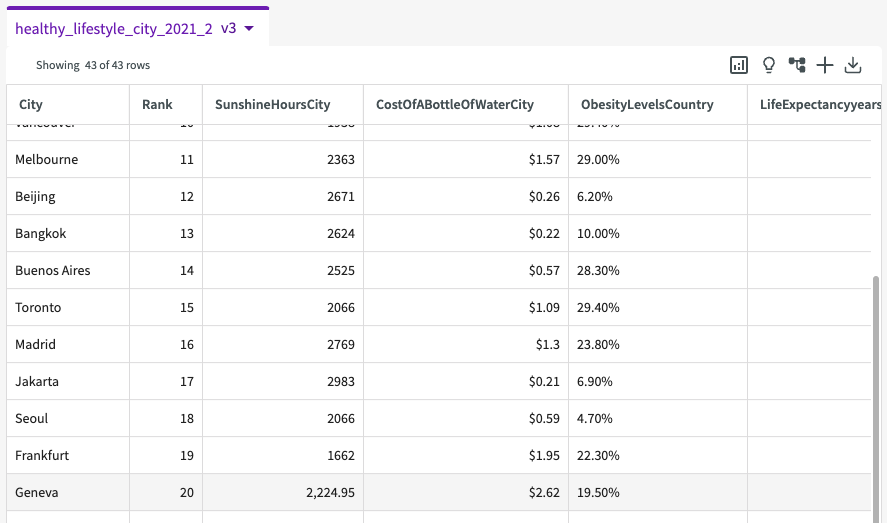
The null value is replaced with the column's average (2,224.95) and a new dataset is created.