Conversations
Data Assistant conversations offer a simple, chat-based interface where you can enter freeform questions about your data and leverage generative AI to produce insights.
Open a New Conversation
By default, the Data Assistant is open in new sessions. You can toggle it on or off by clicking Data Assistant in the skill menu. To resize the Data Assistant conversation, click and drag the left edge. Alternatively, if you prefer to view the conversation in a full window, use the Data Assistant tab.
Conversations are unique to the session they're created in. The Data Assistant remembers the questions asked and responses given in each conversation, but these questions and responses can only be referenced in the same session they were created in.
If you've performed some actions on your data earlier in your session, those actions are also recorded in the conversation history.
Ask Questions
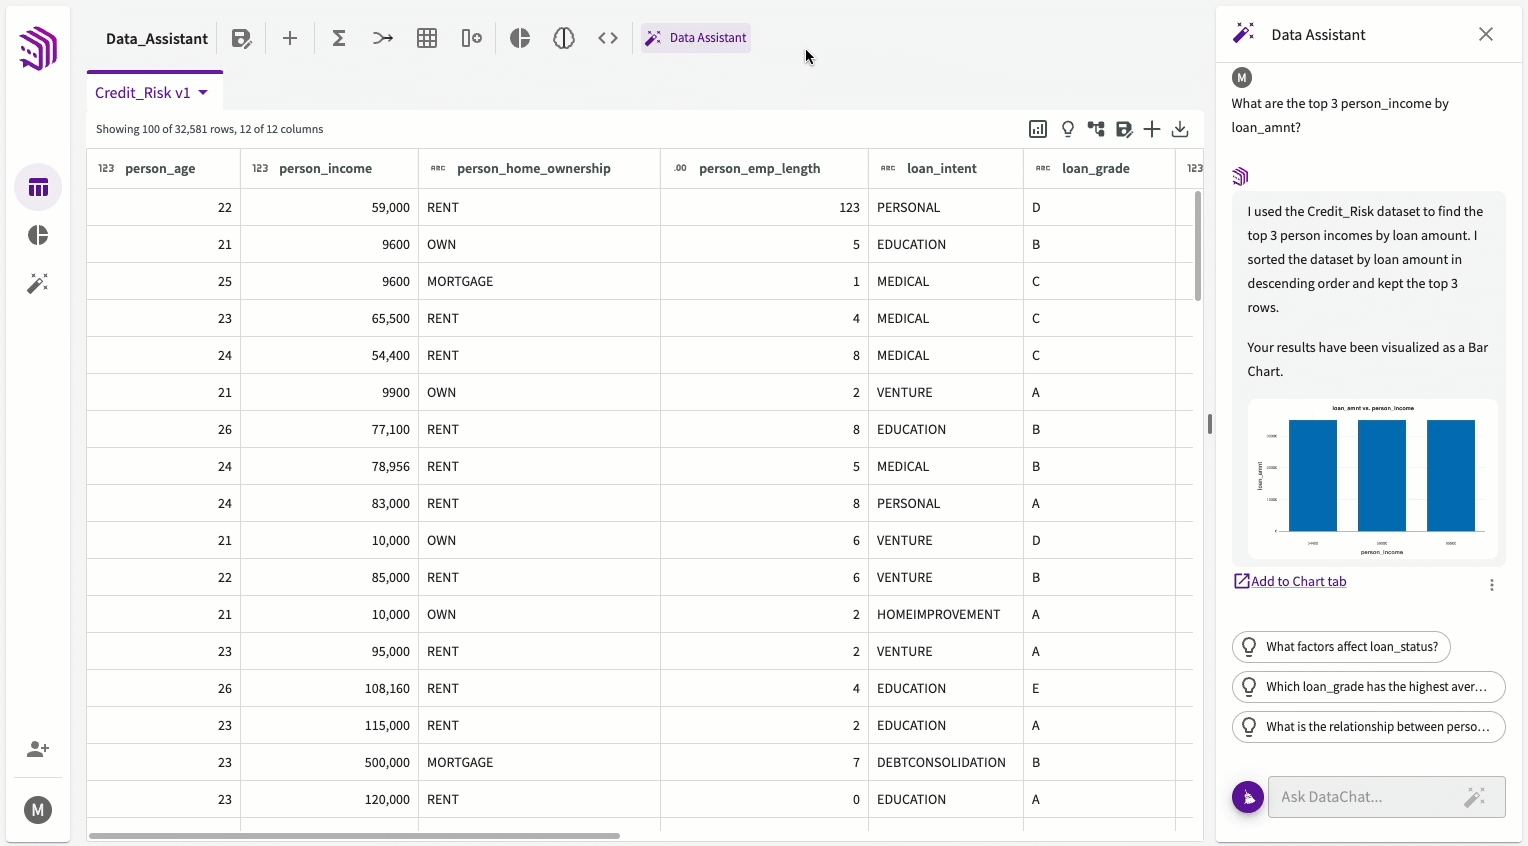
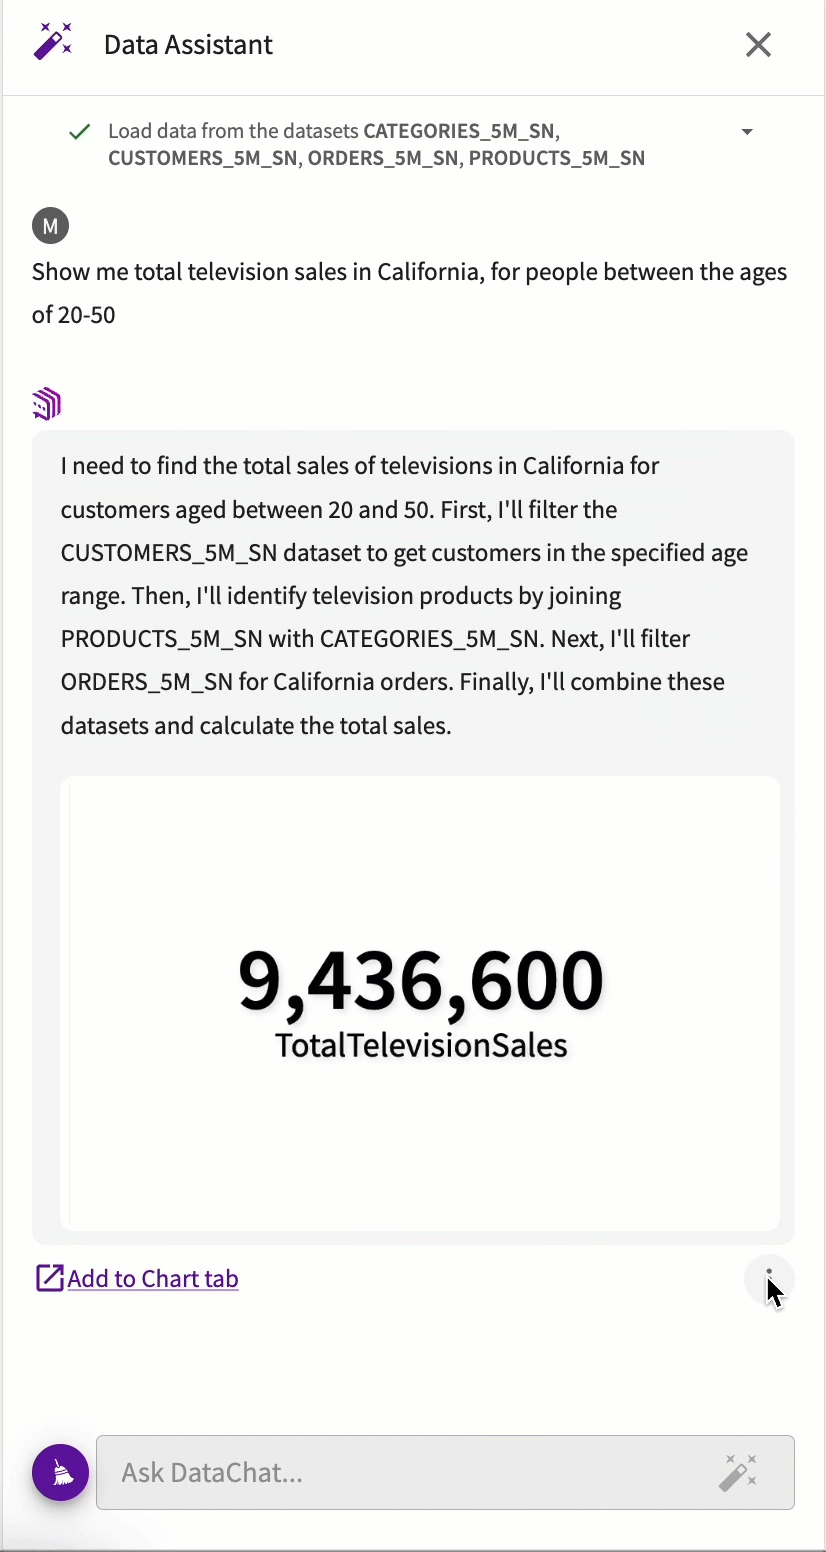
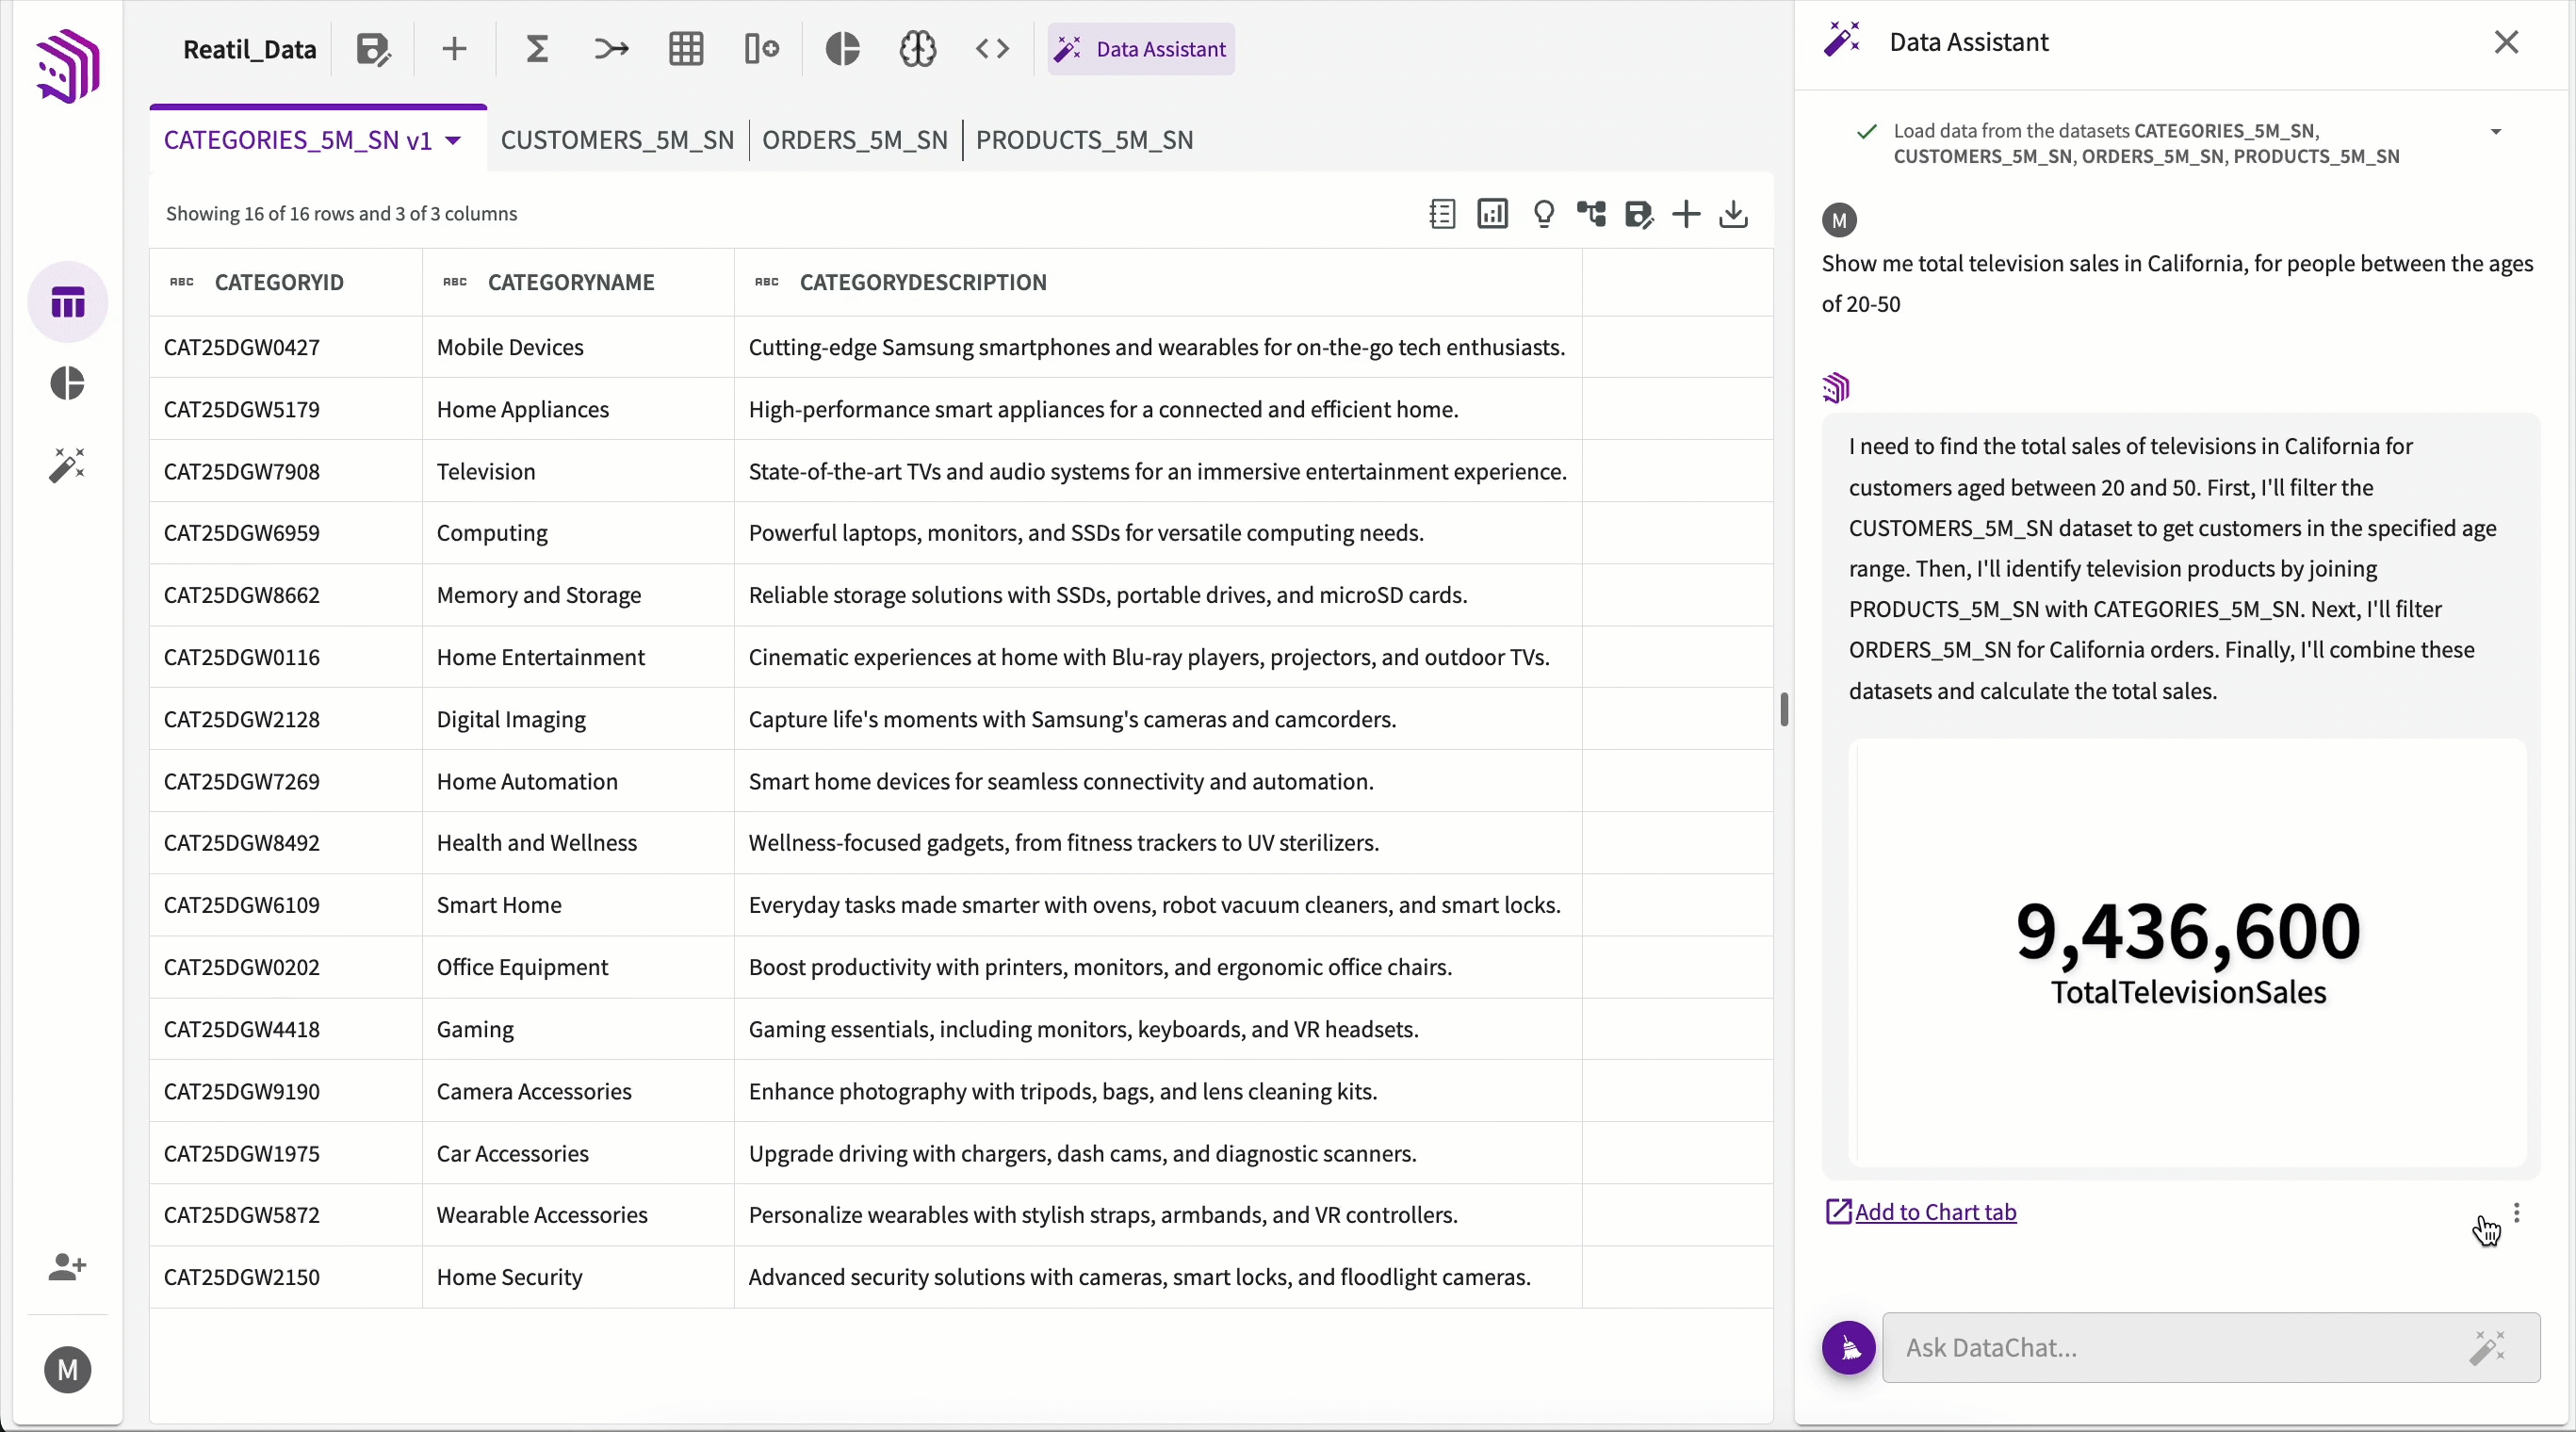
Once data is loaded into your session, you can begin asking questions. Enter your question in natural language, then click the wand icon or press Enter to let the Data Assistant find the answer. For example, if you wanted to know how many records are in the current dataset, you could ask, “How many records are in this dataset?”
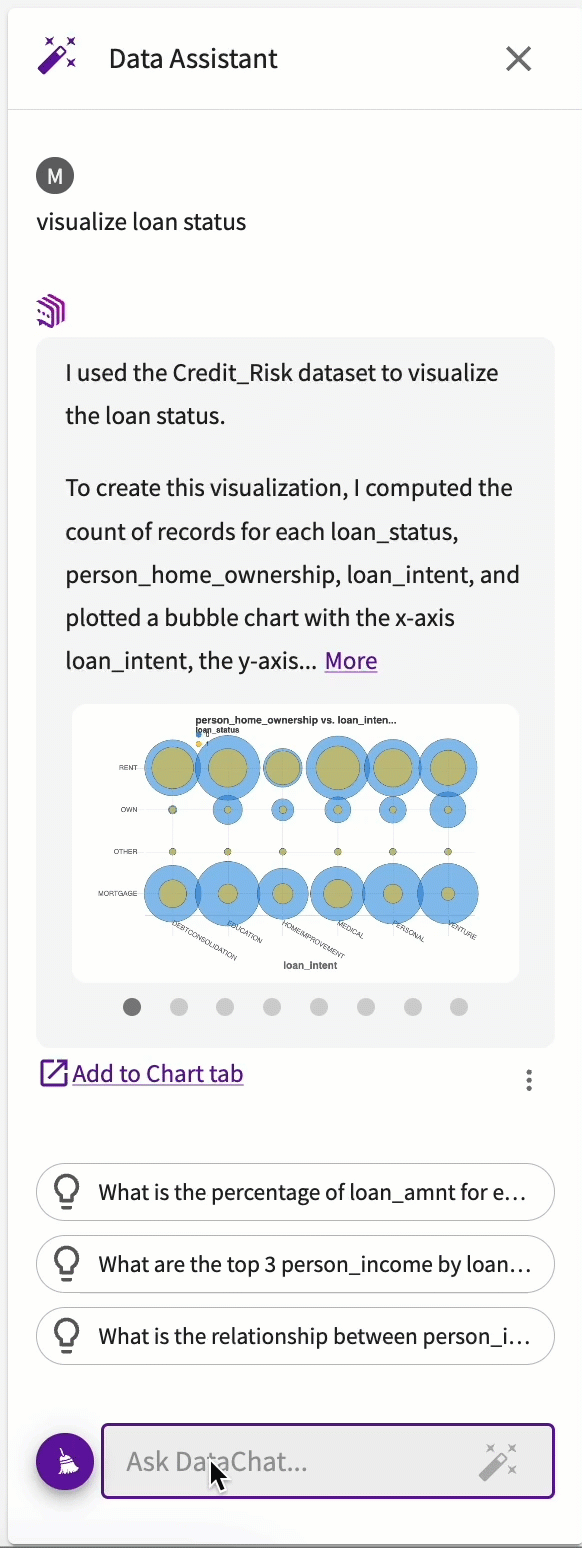
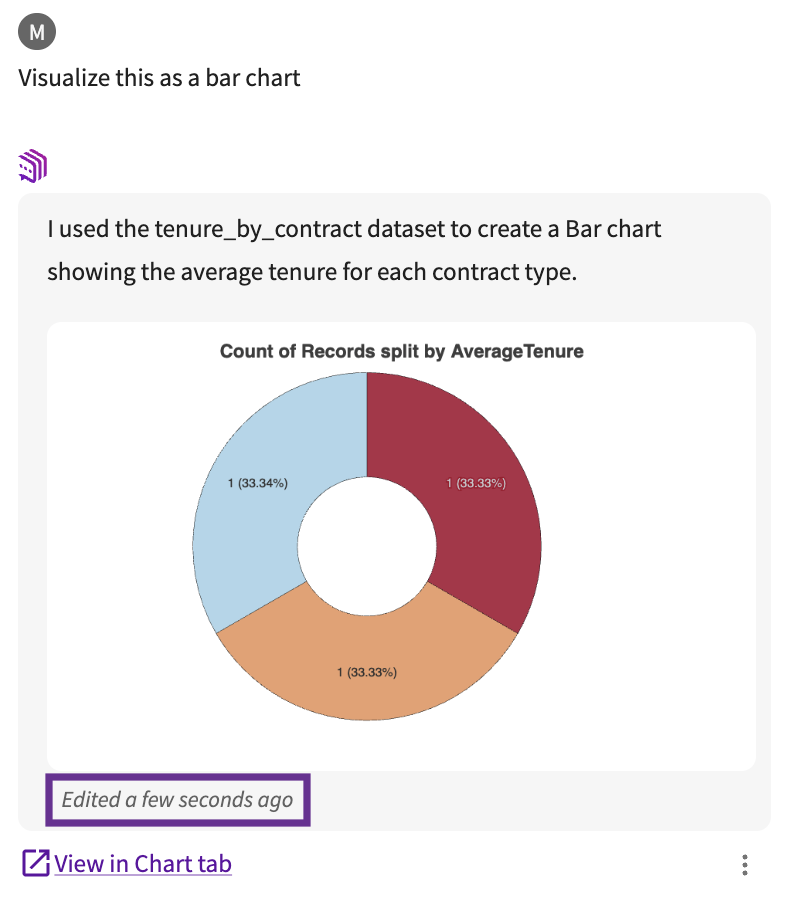
You can also ask the Data Assistant to generate visualizations. For example, if you wanted to view the sales data month over month, you could ask, "Plot a visualization to show average sales for each month," or, if you'd like to be more specific, "Plot a bar chart to show average sales for each month."
Some chart types are not available in the Data Assistant, including box, horizontal bar, and stacked area. Refer to Chart Types for more information.
Responses
When you ask a question, the Data Assistant automatically determines and runs the steps needed to produce an answer. You can watch the solution progress as it’s built, and the response header shows a summary of the steps taken.
Responses can include charts, tables, or both, depending on the complexity of the question. You can add these outputs directly to your Data or Chart tab by clicking Add to Data tab or Add to Chart tab below the output.
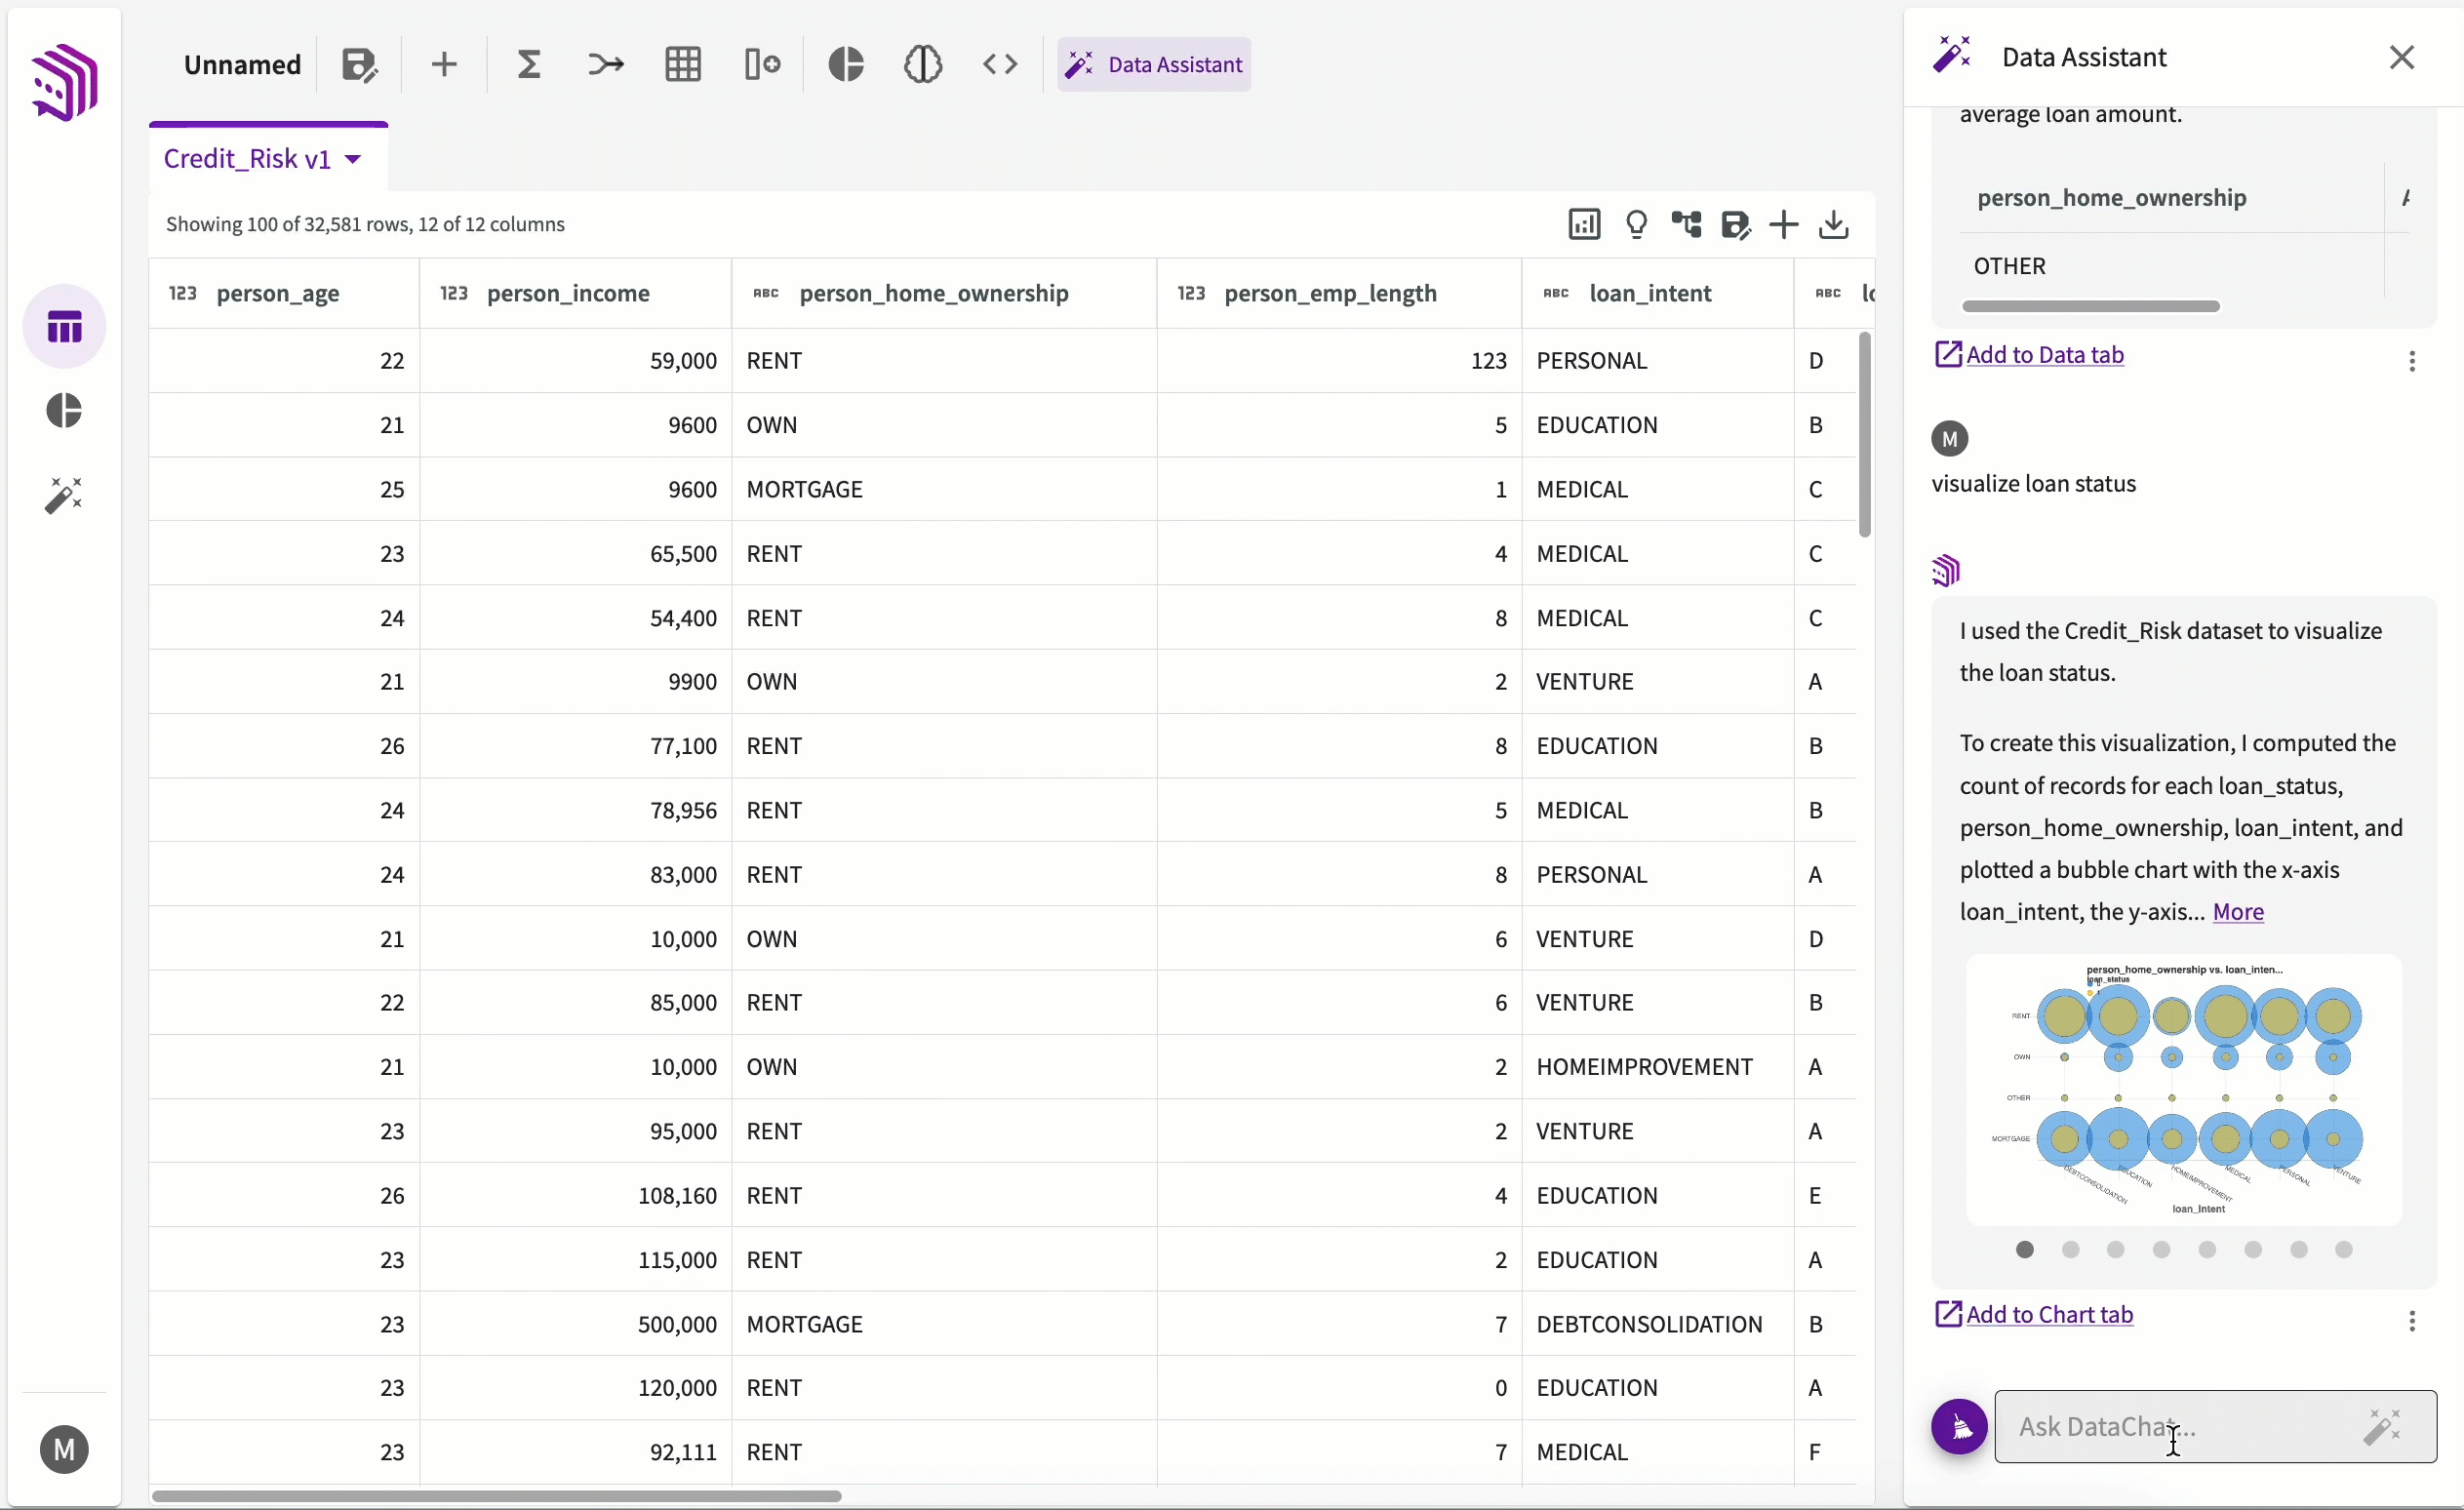
Charts also display the dataset used and, if edited, the timestamp of the latest modification.
Occasionally, a response may return an empty dataset. In these cases, the Data Assistant provides hints about potential issues with the query rather than definitive explanations, as it does not have visibility into your data values. These hints can help you to identify which step in your workflow may have caused the empty result or pinpoint specific parts of that step to adjust or refine for better outcomes.
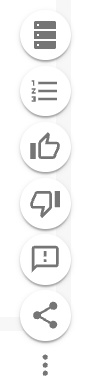
More Response Options
Each response includes a More menu, where you can explore additional context, technical detail, and options for feedback and sharing.
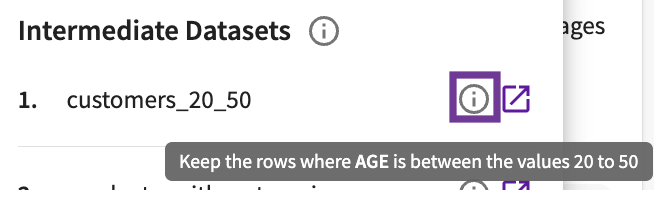
Intermediate Datasets
When the Data Assistant modifies a dataset to answer your question, by applying joins, filters, aggregations, or other steps, those intermediate datasets are saved and available to view. To view them, Click the More menu > Intermediate Datasets.
Each dataset corresponds to a specific step in the workflow. Hover the (i) icon to see which action it came from, or click the purple box to open the dataset in the Data tab.

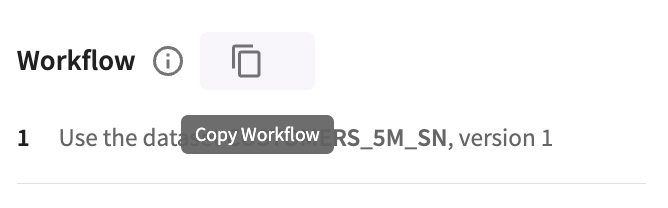
Underlying Workflow
To view a detailed breakdown of how the response was generated, click More menu > Workflow to see the steps used.

You can also copy the full workflow steps with the Copy Workflow button.
Feedback Buttons
To provide feedback on a response, use the thumbs-up or thumbs-down buttons. This helps improve future results.
If Improve Data Assistant responses based on past feedback is toggled "On", future responses will be refined based on positive feedback to better align with your business terms and context.
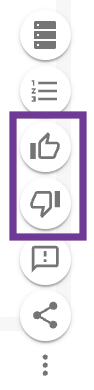
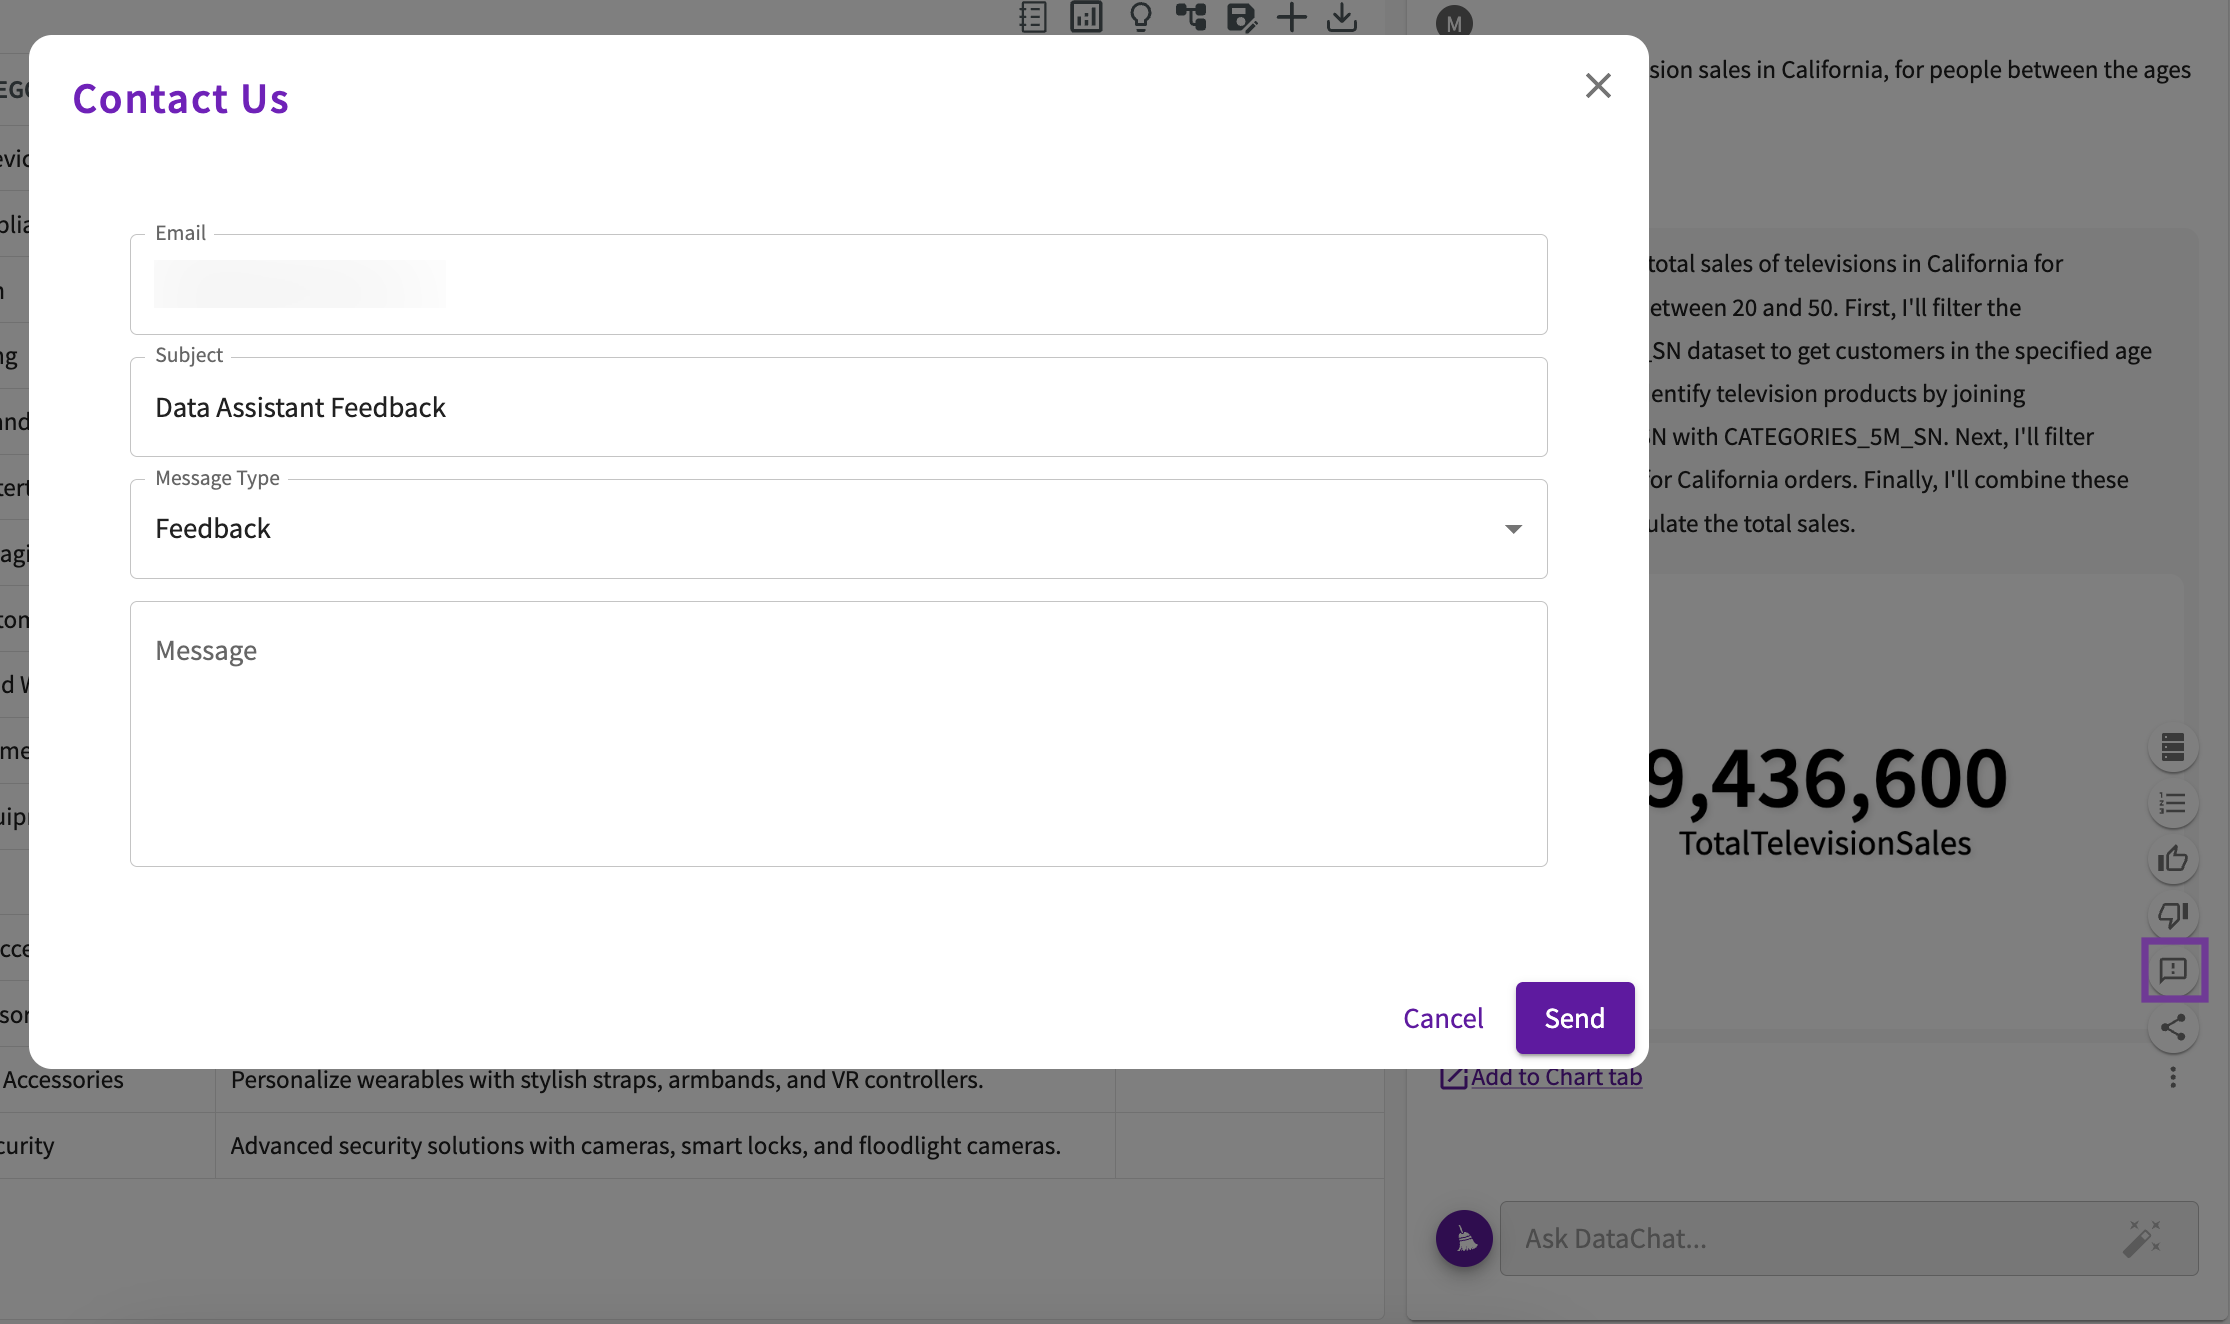
To provide detailed feedback, click More menu > Message to open the Contact Us form.
Share Responses
To share responses through a public link, click More menu > Share. Note that this only shares the specified response, not the entire conversation history.
Next Steps
Continue your analysis by asking follow-up questions, or switch to the Chart or Data tab for further exploration. All actions are captured in the conversation history and can be revisited later.
Clear Topic
To start a new conversation, click Clear your topic. This resets the session context so that previous questions and answers aren’t considered in future prompts.
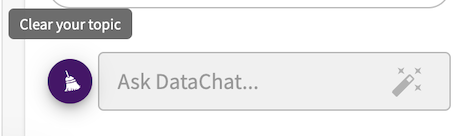
When the conversation is successfully cleared, the button becomes disabled until more questions are asked.