Summarize Large Datasets with Pivot
Summarizing large datasets can help you to better understand, identify, and compare specific aspects of your data. In this example, we'll demonstrate how to create pivot tables to summarize large datasets.
Load Our Data
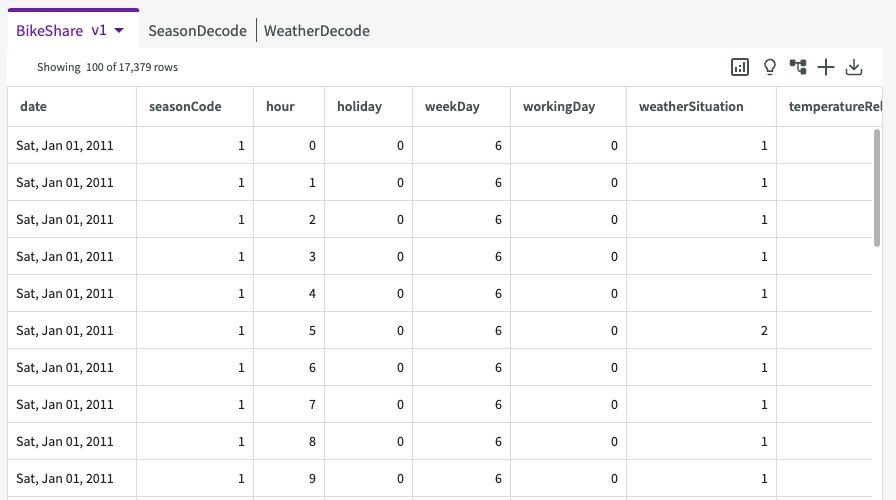
To start, Load the "BikeShare.xlsx Dataset" into your session. We're given a sample of our data that looks something like this:
Extract Our Data
Let's prepare our data by creating a new column using Extract to find the week of the year for each row. Later, we'll use this information to dig into the data further.
- Click Add Column > Extract in the skill menu.
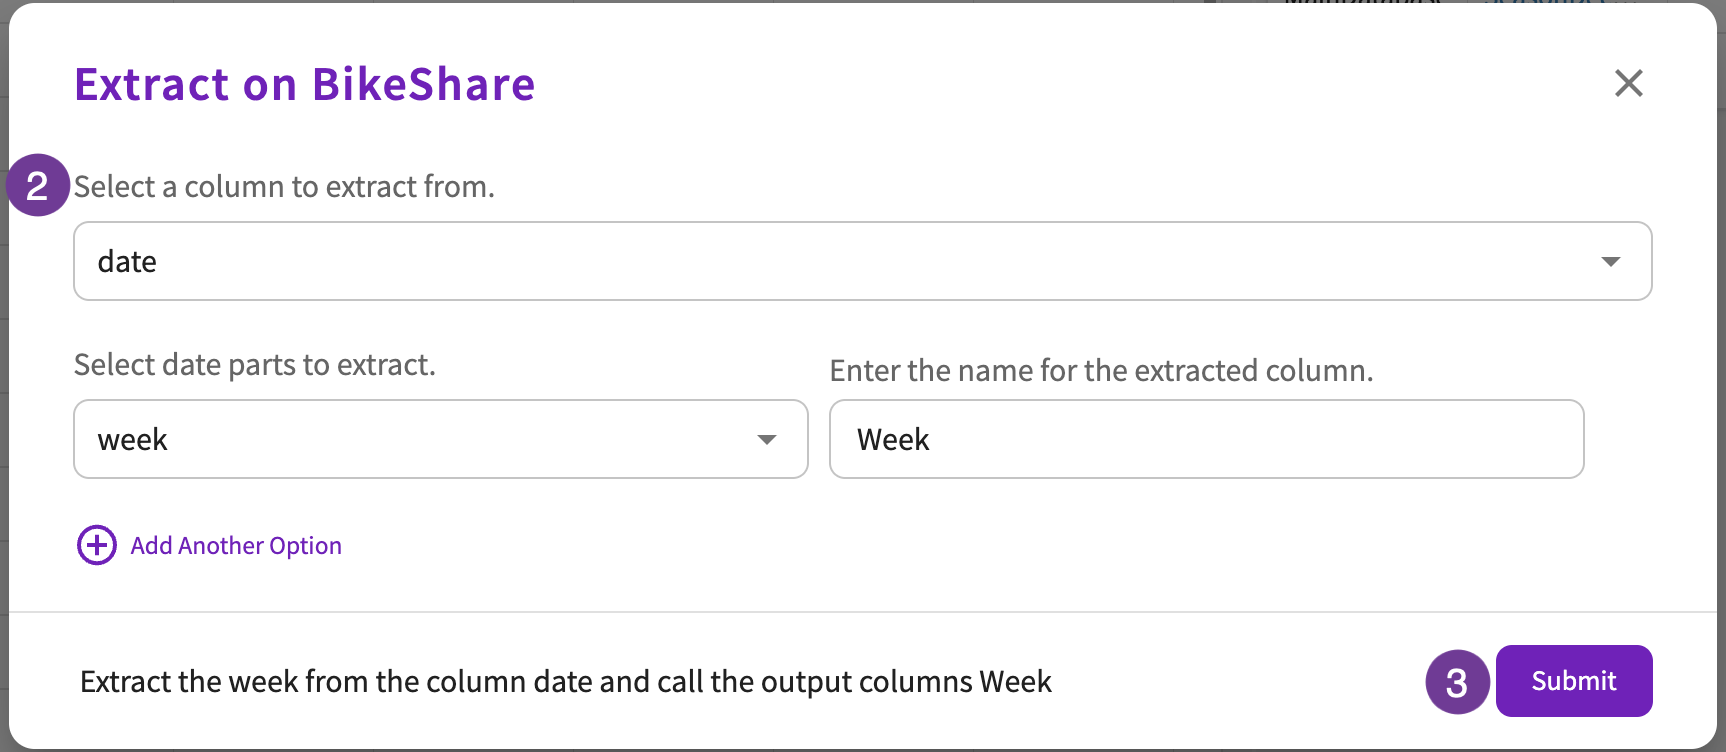
- Enter "date" for the column, "week" for the date parts to extract, and "Week" for the name of the extracted column.
- Click Submit.
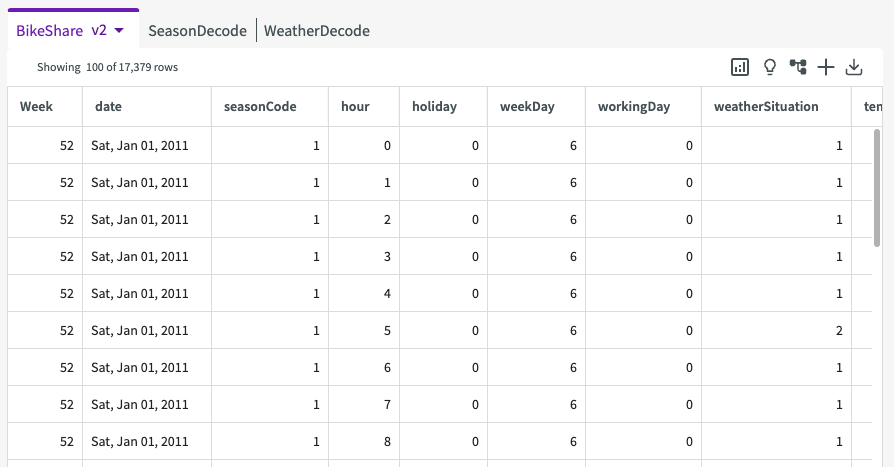
This gives us the following table. As we can see, the dates of recorded registered riders are now listed with their corresponding week.
Create a Pivot Table
Currently, our dataset has over 17,000 rows. Let's create a pivot table to make this dataset more manageable. Let's say that we'd like to show the total number of registered riders for each week and weather situation.
- Click Aggregate > Pivot in the skill menu.
- Select "total" for the aggregate.
- Select "registeredRiders" for the aggregate column.
- Select "Week" for the pivot rows.
- Select "weatherSituation" for the pivot columns.
- Click Submit
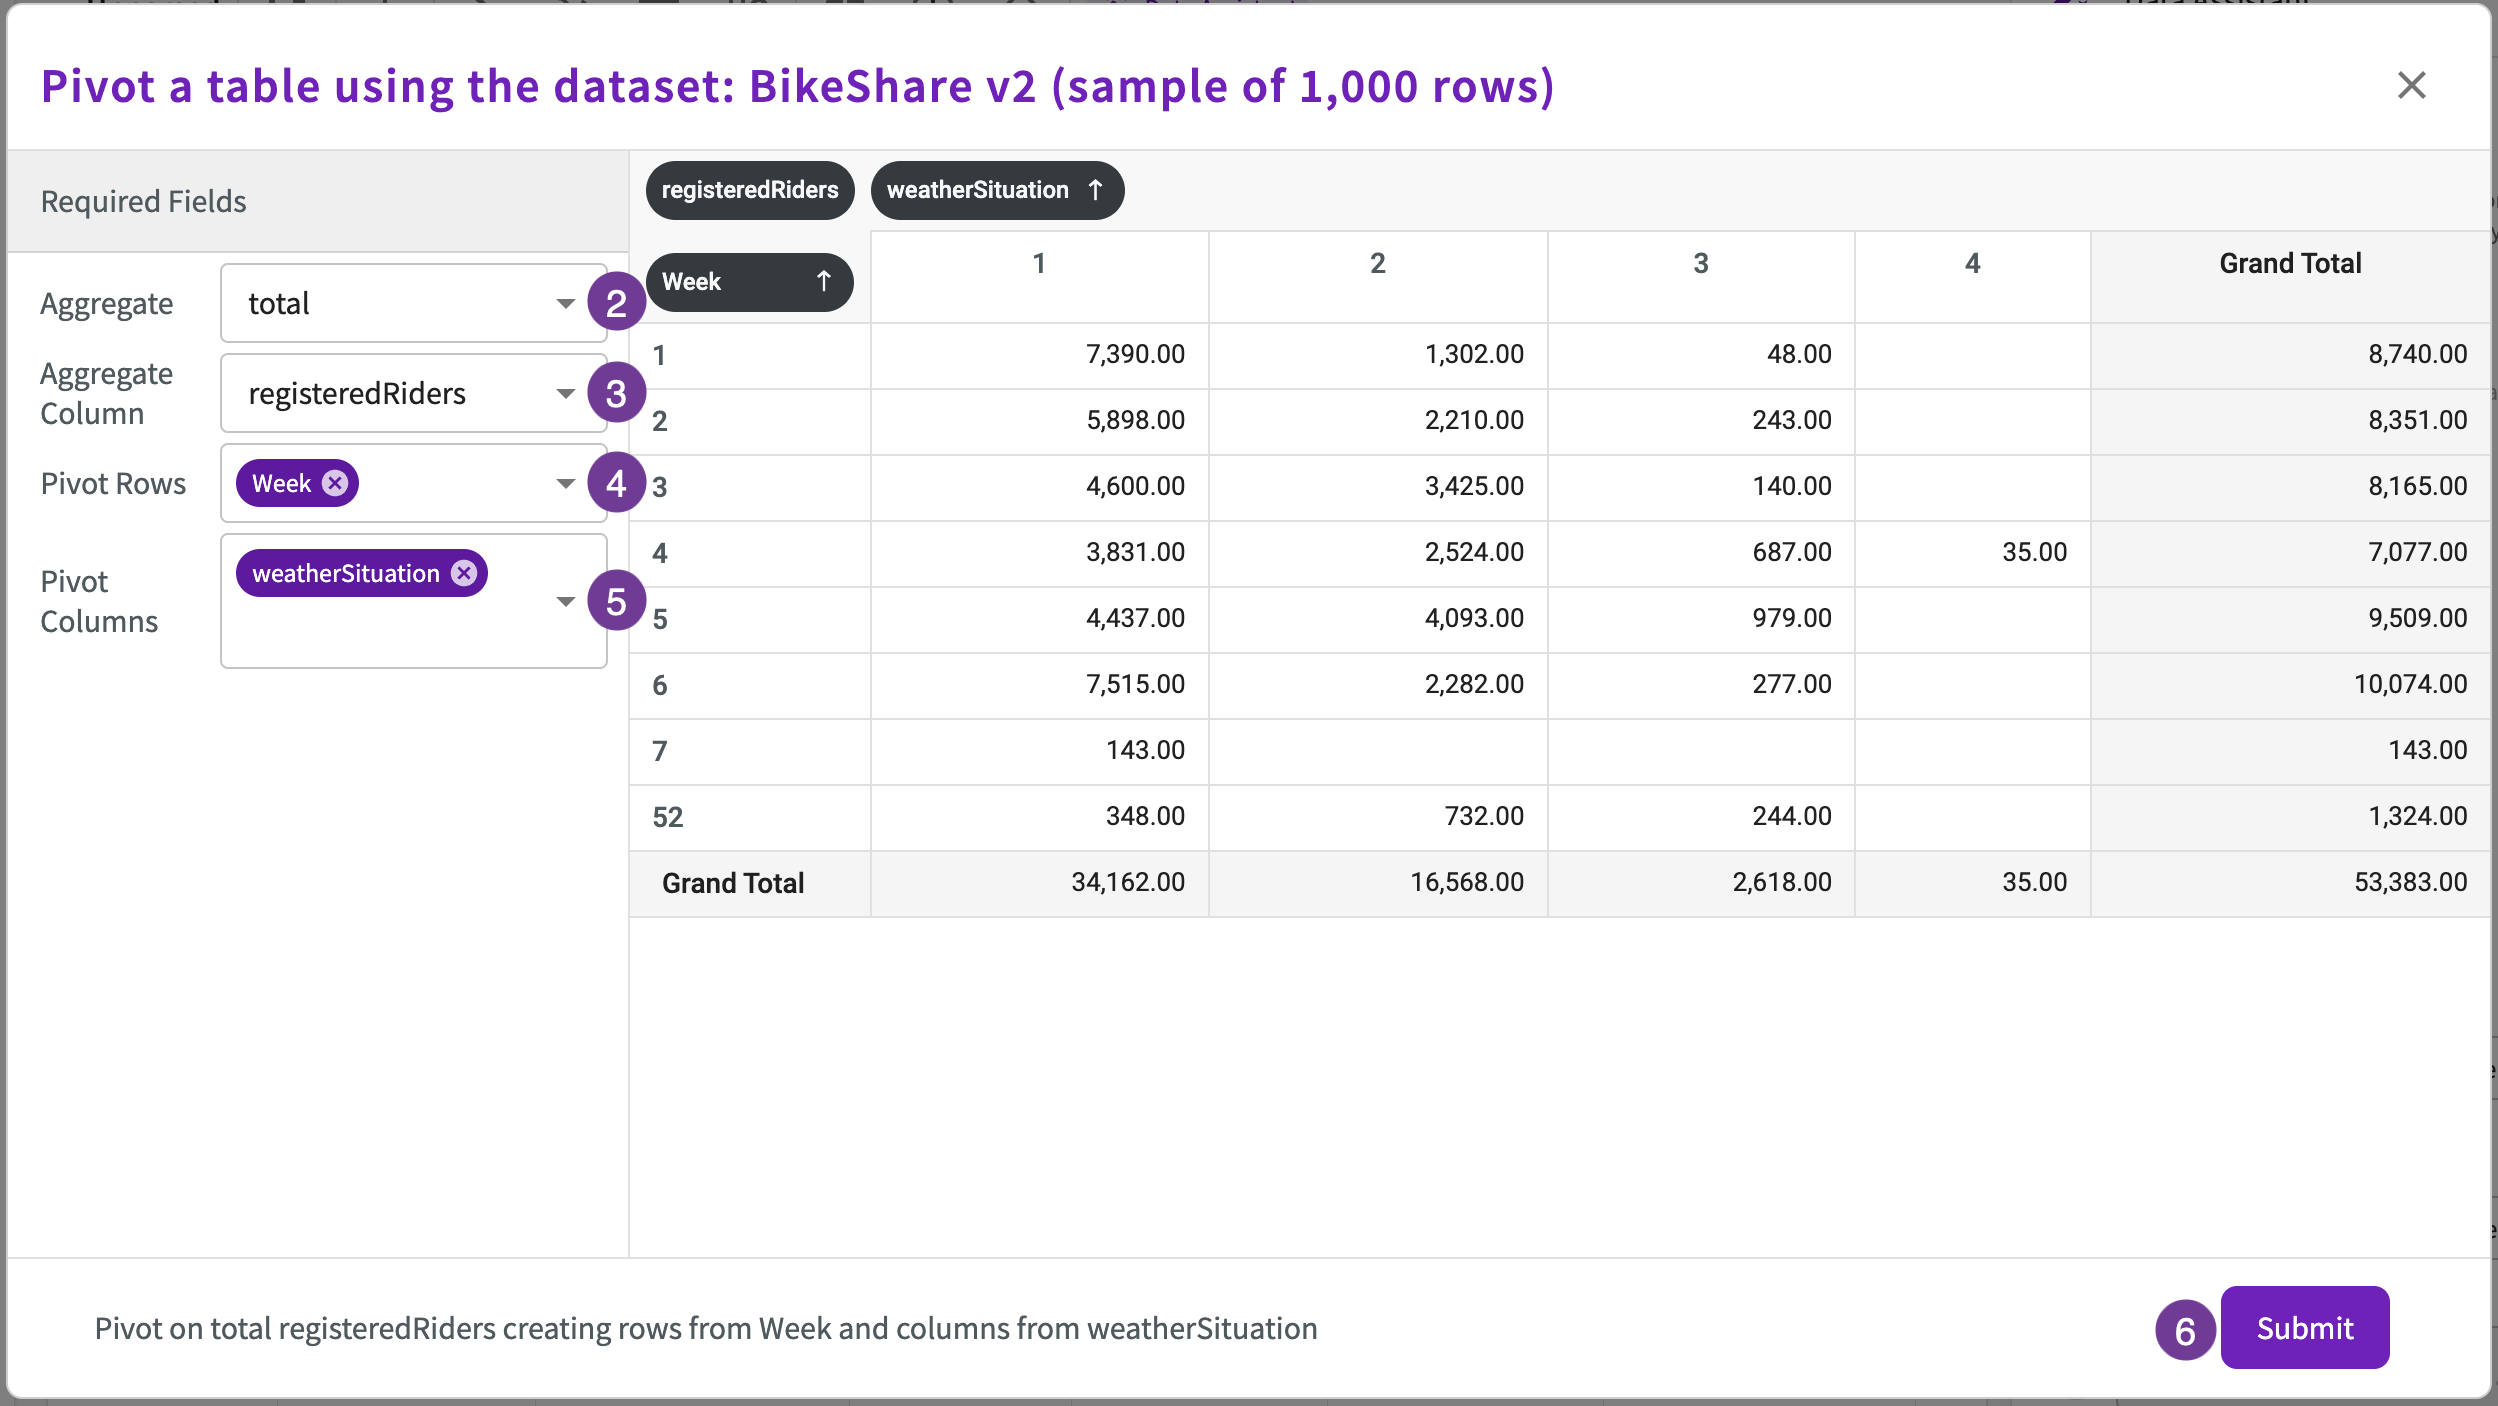
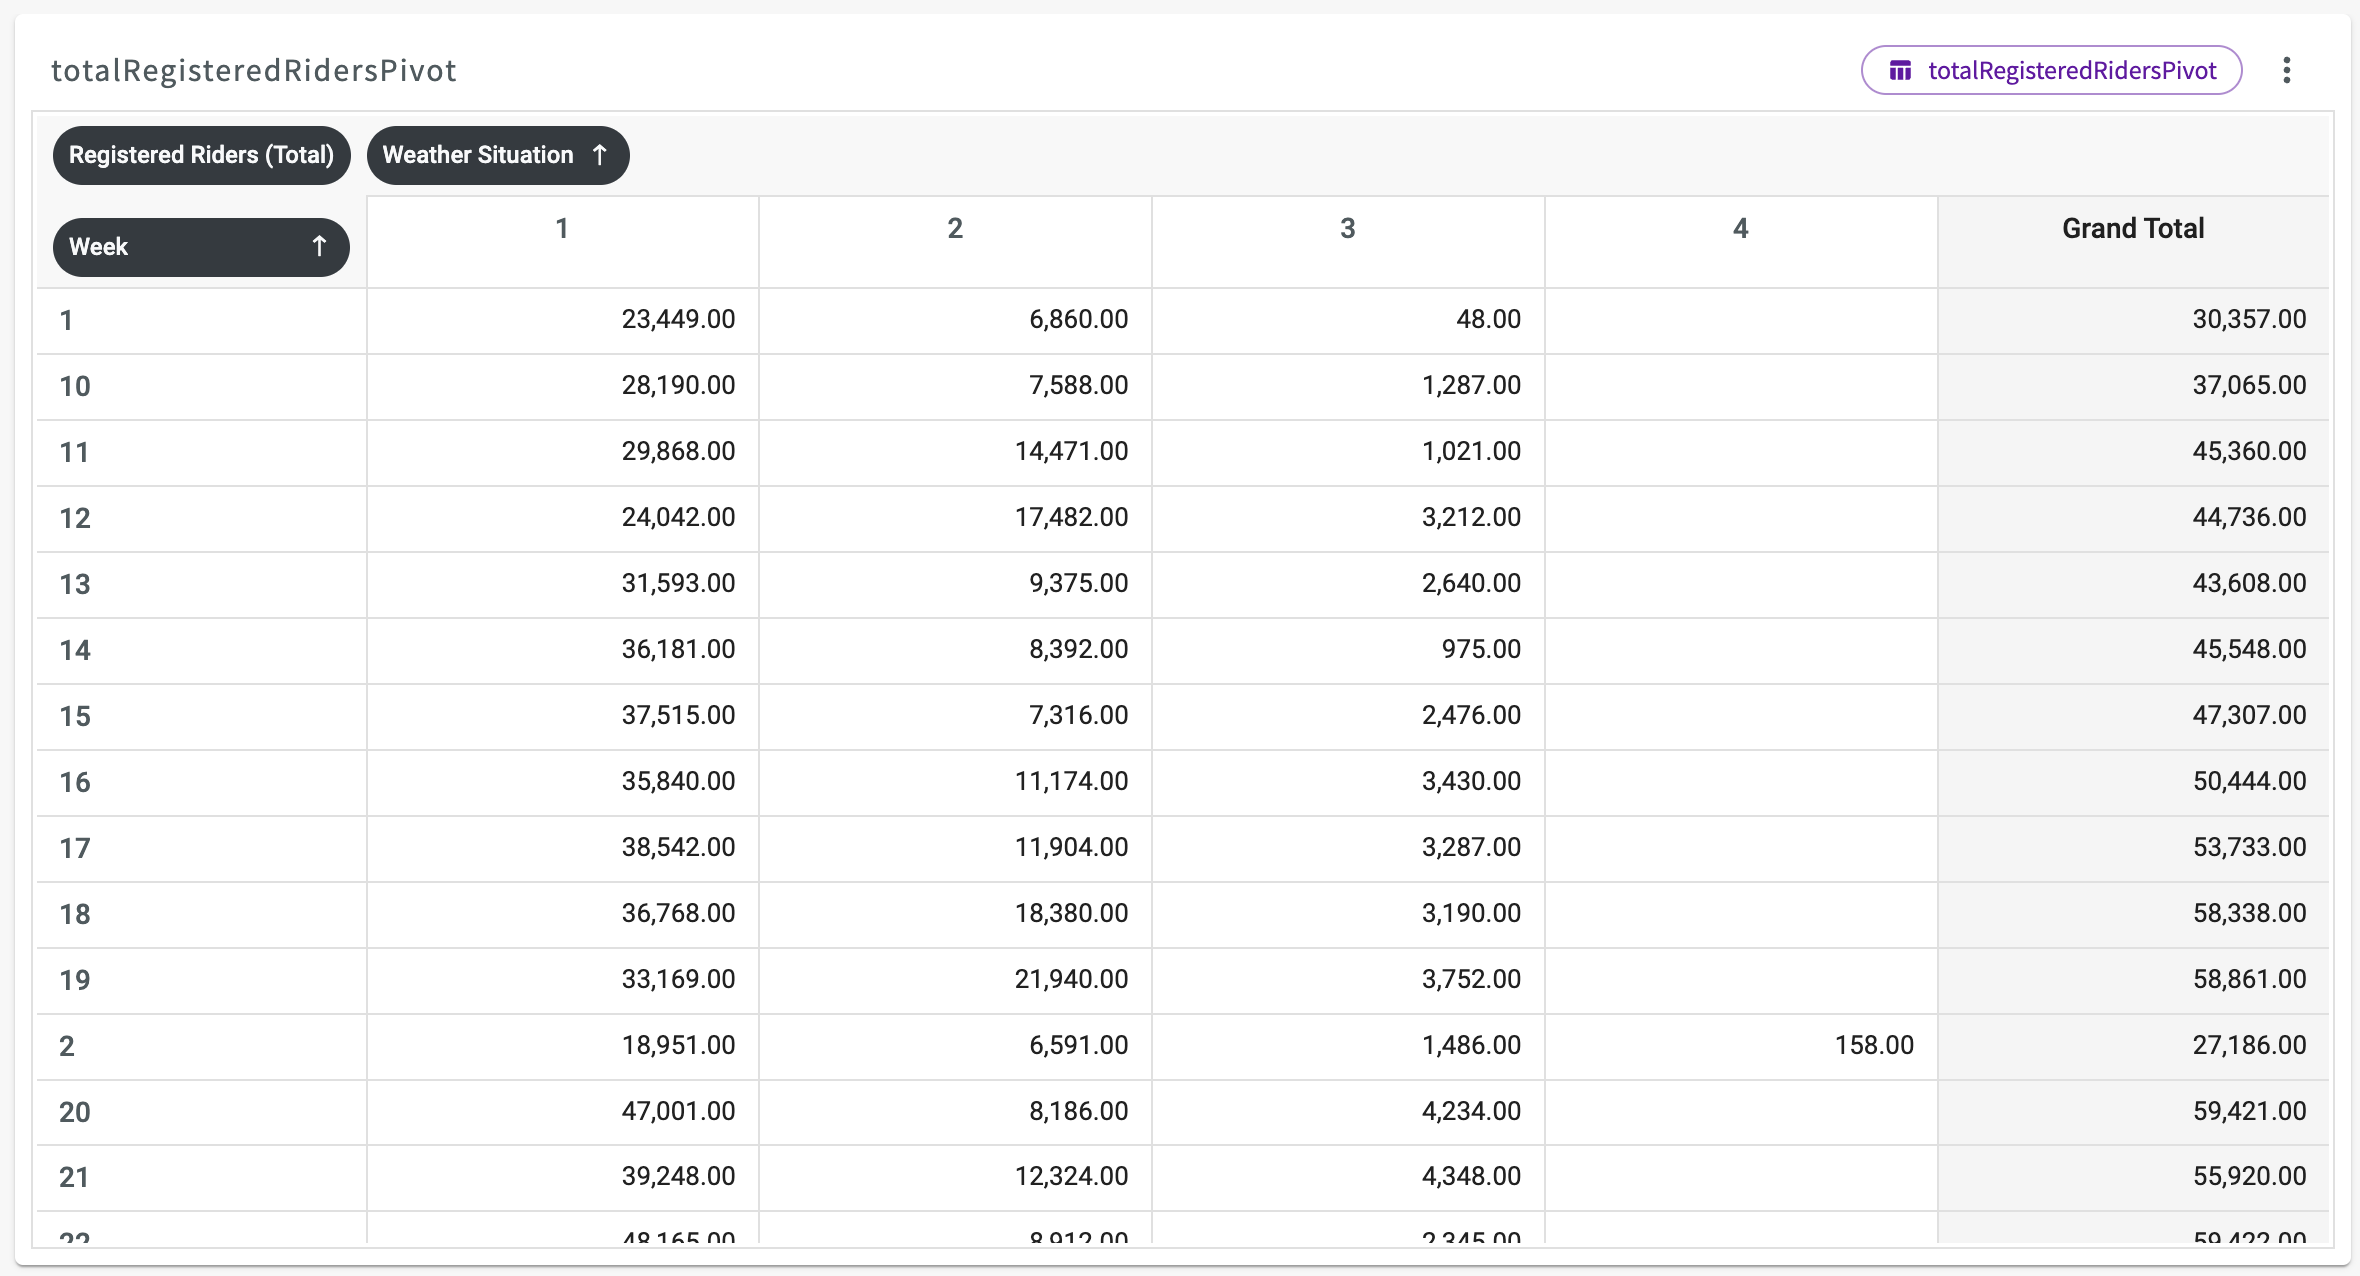
This creates a new pivot table in the Chart tab, "totalRegisteredRidersPivot", that summarizes the total number of registered riders for each week in each weather situation.